Postnatal isl1+ cardioblasts enter fully differentiated cardiomyocyte lineages
- PMID: 15703750
- PMCID: PMC5578466
- DOI: 10.1038/nature03215
Postnatal isl1+ cardioblasts enter fully differentiated cardiomyocyte lineages
Erratum in
- Nature. 2007 Apr 19;446(7138):934
Abstract
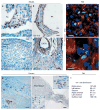
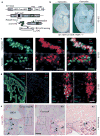
The purification, renewal and differentiation of native cardiac progenitors would form a mechanistic underpinning for unravelling steps for cardiac cell lineage formation, and their links to forms of congenital and adult cardiac diseases. Until now there has been little evidence for native cardiac precursor cells in the postnatal heart. Herein, we report the identification of isl1+ cardiac progenitors in postnatal rat, mouse and human myocardium. A cardiac mesenchymal feeder layer allows renewal of the isolated progenitor cells with maintenance of their capability to adopt a fully differentiated cardiomyocyte phenotype. Tamoxifen-inducible Cre/lox technology enables selective marking of this progenitor cell population including its progeny, at a defined time, and purification to relative homogeneity. Co-culture studies with neonatal myocytes indicate that isl1+ cells represent authentic, endogenous cardiac progenitors (cardioblasts) that display highly efficient conversion to a mature cardiac phenotype with stable expression of myocytic markers (25%) in the absence of cell fusion, intact Ca2+-cycling, and the generation of action potentials. The discovery of native cardioblasts represents a genetically based system to identify steps in cardiac cell lineage formation and maturation in development and disease.
Conflict of interest statement
The authors declare that they have no competing financial interests.
Figures


Comment in
-
Cardiology: solace for the broken-hearted?Nature. 2005 Feb 10;433(7026):585-7. doi: 10.1038/433585a. Nature. 2005. PMID: 15703729 No abstract available.
Similar articles
-
Cardiology: solace for the broken-hearted?Nature. 2005 Feb 10;433(7026):585-7. doi: 10.1038/433585a. Nature. 2005. PMID: 15703729 No abstract available.
-
Islet-1 cells are cardiac progenitors present during the entire lifespan: from the embryonic stage to adulthood.Stem Cells Dev. 2010 Oct;19(10):1601-15. doi: 10.1089/scd.2009.0483. Stem Cells Dev. 2010. PMID: 20109033
-
Biology of Isl1+ cardiac progenitor cells in development and disease.Cell Mol Life Sci. 2007 Mar;64(6):674-82. doi: 10.1007/s00018-007-6520-5. Cell Mol Life Sci. 2007. PMID: 17380308 Free PMC article. Review.
-
Nkx2-5- and Isl1-expressing cardiac progenitors contribute to proepicardium.Biochem Biophys Res Commun. 2008 Oct 24;375(3):450-3. doi: 10.1016/j.bbrc.2008.08.044. Epub 2008 Aug 21. Biochem Biophys Res Commun. 2008. PMID: 18722343 Free PMC article.
-
Islet1-expressing cardiac progenitor cells: a comparison across species.Dev Genes Evol. 2013 Mar;223(1-2):117-29. doi: 10.1007/s00427-012-0400-1. Epub 2012 Apr 24. Dev Genes Evol. 2013. PMID: 22526874 Free PMC article. Review.
Cited by
-
Expansion and patterning of cardiovascular progenitors derived from human pluripotent stem cells.Nat Biotechnol. 2015 Sep;33(9):970-9. doi: 10.1038/nbt.3271. Epub 2015 Jul 20. Nat Biotechnol. 2015. PMID: 26192318
-
GPCRs in stem cell function.Prog Mol Biol Transl Sci. 2013;115:175-216. doi: 10.1016/B978-0-12-394587-7.00005-1. Prog Mol Biol Transl Sci. 2013. PMID: 23415095 Free PMC article. Review.
-
Right ventricular phenotype, function, and failure: a journey from evolution to clinics.Heart Fail Rev. 2021 Nov;26(6):1447-1466. doi: 10.1007/s10741-020-09982-4. Heart Fail Rev. 2021. PMID: 32556672 Free PMC article. Review.
-
The cardiopharyngeal mesoderm contributes to lymphatic vessel development in mouse.Elife. 2022 Oct 5;11:e81515. doi: 10.7554/eLife.81515. Elife. 2022. PMID: 36196867 Free PMC article.
-
Current status of cell-based therapy for heart failure.Curr Heart Fail Rep. 2013 Jun;10(2):165-76. doi: 10.1007/s11897-013-0134-z. Curr Heart Fail Rep. 2013. PMID: 23504442 Review.
References
-
- Chien KR. Stem cells: lost in translation. Nature. 2004;428:607–608. - PubMed
-
- Epstein JA. Developing models of DiGeorge syndrome. Trends Genet. 2001;17:S13–S17. - PubMed
-
- Chien KR, Olson EC. Converging pathways and principles in heart development and disease: CV@CSH. Cell. 2002;110:153–162. - PubMed
-
- Rosenthal N. Prometheus’s vulture and the stem cell promise. N Engl J Med. 2003;346:267–274. - PubMed
-
- Bischoff R. In: Myogenesis. Engel AG, Franszini-Armstrong C, editors. McGraw-Hill; New York: 1994. pp. 97–118.
Publication types
MeSH terms
Substances
Grants and funding
LinkOut - more resources
Full Text Sources
Other Literature Sources
Molecular Biology Databases
Research Materials
Miscellaneous

