. 2005 Apr;16(4):1913-27.
doi: 10.1091/mbc.e04-07-0562. Epub 2005 Feb 9.

Ectopic expression of an activated RAC in Arabidopsis disrupts membrane cycling

Affiliations

Ectopic expression of an activated RAC in Arabidopsis disrupts membrane cycling

Daria Bloch et al. Mol Biol Cell. 2005 Apr.

Abstract

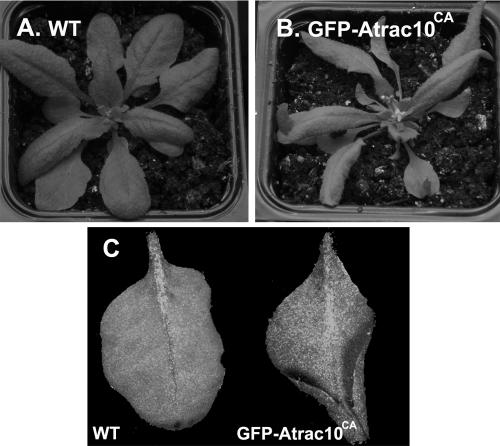
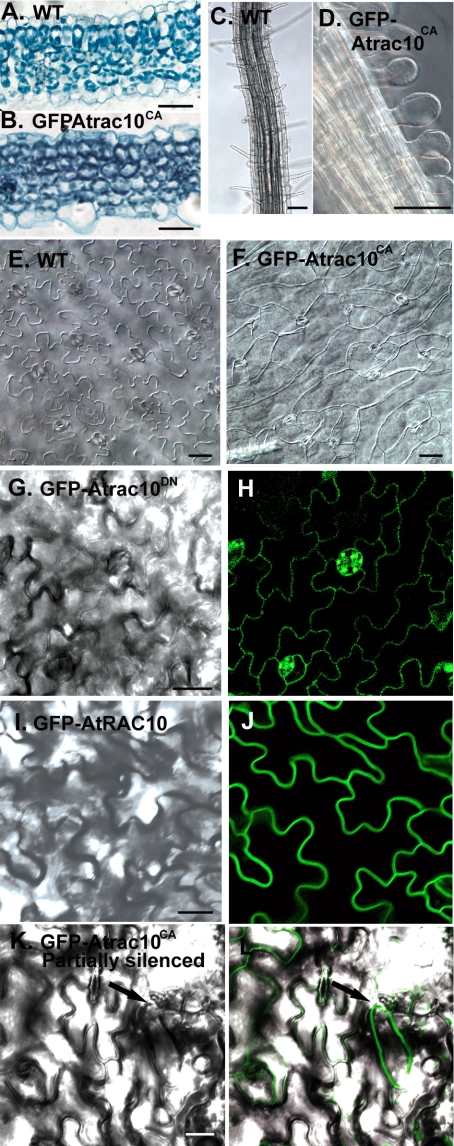
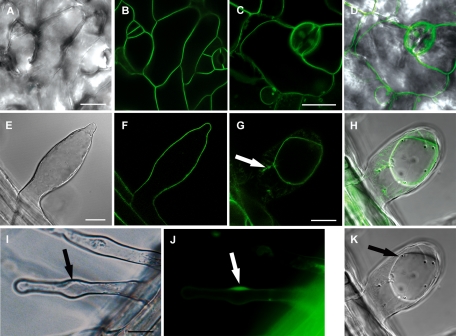
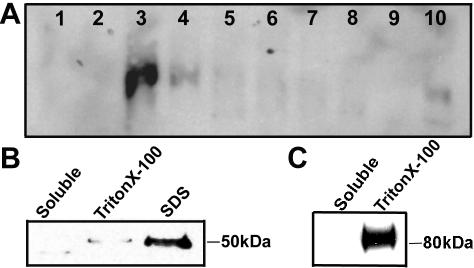
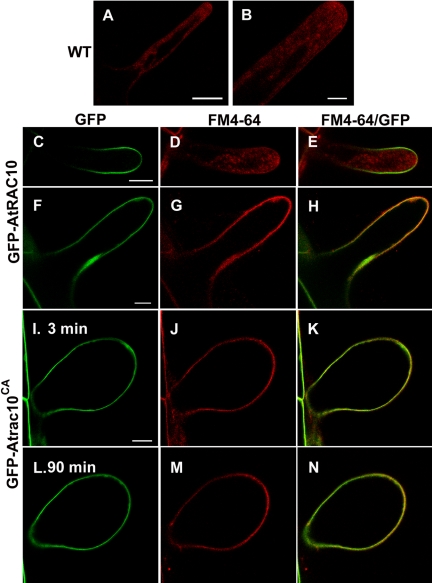
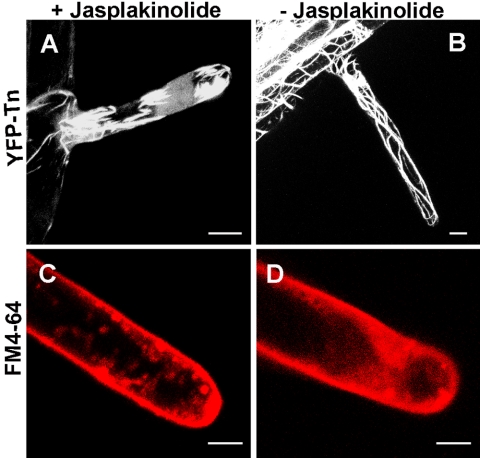
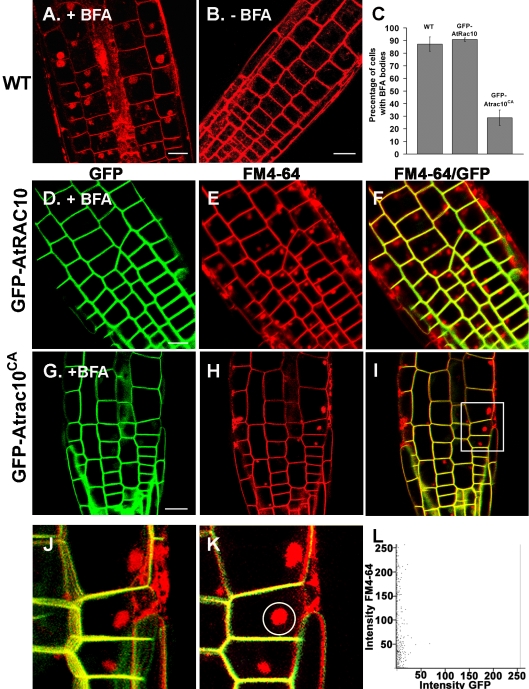
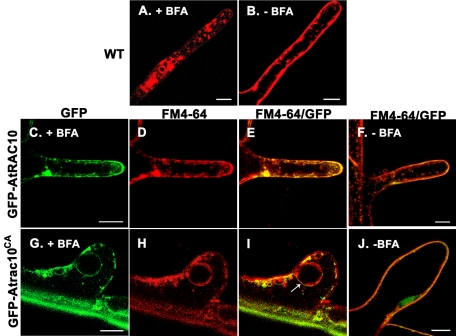
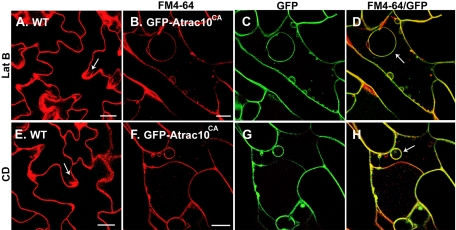
Rho GTPases regulate the actin cytoskeleton, exocytosis, endocytosis, and other signaling cascades. Rhos are subdivided into four subfamilies designated Rho, Racs, Cdc42, and a plant-specific group designated RACs/Rops. This research demonstrates that ectopic expression of a constitutive active Arabidopsis RAC, AtRAC10, disrupts actin cytoskeleton organization and membrane cycling. We created transgenic plants expressing either wild-type or constitutive active AtRAC10 fused to the green fluorescent protein. The activated AtRAC10 induced deformation of root hairs and leaf epidermal cells and was primarily localized in Triton X-100-insoluble fractions of the plasma membrane. Actin cytoskeleton reorganization was revealed by creating double transgenic plants expressing activated AtRAC10 and the actin marker YFP-Talin. Plants were further analyzed by membrane staining with N-[3-triethylammoniumpropyl]-4-[p-diethylaminophenylhexatrienyl] pyridinium dibromide (FM4-64) under different treatments, including the protein trafficking inhibitor brefeldin A or the actin-depolymeryzing agents latrunculin-B (Lat-B) and cytochalasin-D (CD). After drug treatments, activated AtRAC10 did not accumulate in brefeldin A compartments, but rather reduced their number and colocalized with FM4-64-labeled membranes in large intracellular vesicles. Furthermore, endocytosis was compromised in root hairs of activated AtRAC10 transgenic plants. FM4-64 was endocytosed in nontransgenic root hairs treated with the actin-stabilizing drug jasplakinolide. These findings suggest complex regulation of membrane cycling by plant RACs.


Figures

Figure 1.
Figure 1.
Altered morphogenesis of GFP-Atrac10CA–expressing plants. Images of 25-d-old WT (A) and GFP-Atrac10CA transgenic plants (B). The GFP-Atrac10CA leaves were narrower, folded downward at their distal end, and had longer and twisted petioles (B). (C) Abaxial surface of WT and GFP-Atrac10CA leaves.
Figure 2.
Figure 2.
GFP-Atrac10CA–induced cell deformation. (A and B) Safranin/fast-green stained cross sections of rosette leaves of WT (A) and GFP-Atrac10CA (B) plants. Note the lack of clear distinction in the mesophyll between palisade and spongy tissues. (C) DIC image of a root of WT plant with elongated root hairs. (D) DIC image of a root of GFP-Atrac10CA plant with swollen root hairs. (E and F) DIC images of cleared leaf epidermal cells of WT (E) and GFP-Atrac10CA (F) plants. Note the reduced lobing of the mutant cells. (G and H) Epidermal cells of GFP-Atrac10DN plant expressing a dominant negative AtRAC10. DIC image (G) and GFP fluorescent image (H). The GFP-Atrac10DN leaf epidermal cells are similar to those of wild-type cells. (I and J) Leaf epidermal cells of plant expressing a wild-type GFP-AtRAC10. DIC image (I) and GFP fluorescent image (J). Lobing of the GFP-AtRAC10 epidermal cells is similar to that of wild-type. (K and L) Leaf epidermal cells of GFP-Atrac10CA partially silenced plant. The cell morphology is directly related to the level of expression of GFP-Atrac10CA (arrow). DIC image (K) and DIC/GFP overlay (L). (A–F) Images were prepared with a microscope equipped with cooled charged device (CCD) camera. (G–L) Images were prepared with confocal laser scanning microscope (CLSM). Green indicates GFP fluorescence. Bars, 20 μm.
Figure 3.
Figure 3.
Membrane localization of GFP-Atrac10CA in leaf epidermis and root hairs of GFP-Atrac10CA transgenic plants. The subcellular localization of GFP-Atrac10CA was examined in leaf epidermis and root hairs of GFP-Atrac10CA seedlings. (A–D) Leaf epidermal cells were visualized by Nomarsky DIC (A) or GFP fluorescence (B and C) or DIC/GFP overlay (D). Plasmolysis of the cells indicated that the GFP-Atrac10CA protein was localized at the plasma membrane (C and D). (E–H and K) Root hair cells of GFP-Atrac10CA seedlings. Cells were visualized by DIC (E and K), GFP (F and G), or DIC/GFP overlay (H). Plasmolysis of the cells indicated that in swollen root hairs, GFP-Atrac10CA was localized at the plasma membrane (G, H, and K). Arrow in G denotes contact points between plasma membrane and cell wall detected after plasmolysis. Arrow in K denoted the detached plasma membrane. Local swelling on elongated GFP-Atrac10CA root hairs of was associated with accumulation of GFP-Atrac10CA (arrow) (I and J). The root hairs were visualized by Nomarsky DIC (I) and GFP fluorescence (J) on an epifluorescence microscope. Bars, 20 μm.
Figure 4.
Figure 4.
Partitioning of GFP-Atrac10CA in the membrane. Immunoblots of protein extracts prepared from GFP-Atrac10CA transgenic plants (A and B). (A) Membrane flotation experiment. Total protein extracts were adjusted to 73% sucrose solution and placed at the bottom of a 10–73% sucrose density gradient. After centrifugal separation, typical of membrane bound proteins, GFP-Atrac10CA accumulated at fractions 3 and 4, which form the boundary between the 10 and 65% sucrose phases. The numbers in A correspond to gradient fraction from top to botton. (B) After fractionation into soluble and insoluble fractions, the insoluble membrane fractions were fractionated into Triton X-100 (Triton)–soluble and –insoluble fraction. Triton X-100–insoluble material was solubilized with SDS. The majority of GFP-Atrac10CA precipitated in the insoluble fraction and partitioned into the Triton X-100–insoluble, SDS-soluble fraction. The apparent molecular mass of the GFP-Atrac10CA fusion protein is ∼50 kDa (50). (C) Immunoblots of protein extracts prepared from GFP-AtAAT1 transgenic plants. AtAAT1 is a highly hydrophobic membrane localized amino acid transporter (Frommer et al., 1995). In contrast to GFP-AtRAC10CA, GFP-AtAAT1 was solubilized from the membrane with Triton X-100. The apparent molecular mass of the GFP-AtAT1 fusion protein is ∼80 kDa.
Figure 5.
Figure 5.
Actin organization in GFP-Atrac10CA root hairs. (A) Longitudinal-oriented actin bundles and perinuclear mesh were detected in a developing root hair of YFP-Tn–expressing Col-0 (WT) plant. (B) Transverse-oriented actin bundles in YFP-Tn GFP-Atrac10CA double transgenic plants. (C) The same image as in B after three-dimensional (3D) projection and 120° tilting to a top to bottom view. Transverse bundles circumventing the cell were seen. (D) A YFP-Tn (labeled red) GFP-Atrac10CA (labeled green) overlay image. The image was produced by a channel dye separation after excitation with argon laser at 488 nm. (A–C) Images were produced after excitation with argon laser at 514 nm to minimize GFP fluorescence. (A, B, and D) Maximum projection images of multiple confocal scans. Bars, 10 μm.
Figure 6.
Figure 6.
Membrane internalization in wild-type, GFP-AtRAC10, and GFP-Atrac10CA root hairs. Immediate internalization of membranes was detected in root hairs labeled with the membrane and endocytosis marker FM4-64 (A and B). (A) Entire root hair. (B) Magnification of the same root hair as in A. (C–E) Wild-type–like root hair of GFP-At-RAC10 plant. Most of the FM4-64 was internalized within minutes of its application and was not colocalized with GFP-AtRAC10. (F–H) Most of the FM4-64 was not internalized in partially swollen root hairs of GFP-AtRAC10 plants remaining on the plasma membrane colocalized with GFP-AtRAC10 (H, yellow label). Some of the GFP-AtRAC10CA protein accumulated in the nucleus (F and H). (I–N) FM4-64 was not internalized into balloon-shaped swollen root hairs of GFP-Atrac10CA plants. Images were taken either 3 (I–K) or 90 min after dye application (L–N). Green indicates GFP, red indicates FM4-64, and yellow indicates GFP/FM4-64 overlay. (A, B, D, G, J, and M) FM4-64 channel. (C, F, I, and L) GFP channel. (E, H, K, and N) GFP/FM4-64 overlay. Bars, 20 μm (A), 5 μm (B), and 10 μm (C–N). Movies depicting endocytosis of FM4-64 in the same or similar root hairs are shown in the supplemental online material.
Figure 7.
Figure 7.
Quantification signal intensities at defined cellular locations. Signal intensities in the GFP and FM4-64 channels along the marked lines in the insets of each panel. Insets in A–D correspond to Figure 6, B, E, H, and N, respectively. The drop in signal intensities in the FM4-64 channel highlights its distribution in the cell. The computer generated scale corresponds to 28 = 256, in an 8 bit/pixel scan mode.
Figure 8.
Figure 8.
YFP-Tn and FM4-64 stained jasplakinolide-treated root hairs. Jasplakinolide treated (1 μM) (A and C) and control (0.1% methanol) (B and D) root hairs. The jasplakinolide-induced aggregation of actin bundles (A) but did not inhibit internalization of FM4-64 (C). YFP-Tn is labeled in white and FM4-64 in red. Bars, 10 μm (A and B) and 5 μm (C and D).
Figure 9.
Figure 9.
Effects of BFA on wild-type, GFP-AtRAC10, and GFP-Atrac10CA root cells. (A and B) FM4-64 fluorescent images of WT roots treated with BFA (A) and DMSO (B). BFA bodies were detected after the BFA treatments. (D–F) Roots of GFP-AtRAC10 plant treated with BFA. BFA bodies were detected in most of the cells (E). (G–I) Roots of GFP-Atrac10CA plants were treated with BFA. The number of cells with BFA bodies was reduced (I). (C) Percentage of cells with BFA bodies was significantly reduced in GFP-Atrac10CA plants (p ≤ 0.001, t test). One hundred cells were scored in each sample. Counts were repeated with 10 seedlings of WT and GFP-AtRAC10 lines and eight seedlings of GFP-Atrac10CA lines, without significant deviation in the results. Error bars represent SE. (J and K) Enlargement of the region specified by the rectangle in I. (J) Maximum intensity projection stack to verify that labeling of BFA bodies was not dependent on specific focal planes. (L) Quantification of signal intensity per pixel (see Figure 7) in the FM4-64 and GFP channels of a representative BFA body specified by circle on K. The distribution of points on the graph indicated the almost complete absence of GFP signal. Cells were visualized with CLSM. Green indicates GFP, red indicates FM4-64, and yellow indicates colocalization of GFP and FM4-64 in overlay images. Bars, 20 μm.
Figure 10.
Figure 10.
Effects of BFA on wild-type Col-0, GFP-AtRAC10 and GFP-Atrac10CA root hair membranes. FM4-64 fluorescent images of root hairs of wild-type plants treated with BFA (A) or DMSO (B). (C–F) Root hairs of GFP-AtRAC10 plants treated with BFA (C–E) or DMSO (F). (G–J) Root hairs of GFP-Atrac10CA plants treated with BFA (G–I) or DMSO (J). BFA treatments induced formation of vesicles measuring up to 20 μm (I, arrow) labeled with both GFP and FM4-64. Cells were visualized with CLSM. Green indicates GFP, red indicates FM4-64, and yellow indicates colocalization of GFP and FM4-64 in overlay images. Bars, 10 μm.
Figure 11.
Figure 11.
Effects of BFA on wild-type and GFP-Atrac10CA leaf epidermal cells. FM4-64 fluorescence images of WT leaf epidermal cells treated with BFA (A–C) or DMSO (D). Endocytotic vesicles forming funnel-like structures are seen in growth lobes (rectangle) of BFA-treated cells. (B) Enlargement of the rectangle specified area in A. (C) BFA-bodies (arrows). (E–K) GFP-Atrac10CA leaf epidermal cells treated with BFA (E–G and I–K) or DMSO (H). The BFA treatments induced formation of BFA bodies labeled only with FM4-64 (E and G, arrow) and of vesicles reaching diameters of ∼40 μm, displaying colocalization of FM4-64 and GFP-Atrac10CA (E–G [arrowheads] and I–K [arrow]). Cells were visualized with CLSM. Green indicates GFP (F and J), red indicates FM4-64 (A–D, E, and I), and yellow indicates colocalization of GFP and FM4-64 in overlay images (G, H, and K). Bars, 20 μm.
Figure 12.
Figure 12.
Effects of actin-depolymerizing agents Lat-B and CD treatments on epidermal cells of wild-type and GFP-Atrac10CA leaves. FM4-64 fluorescence images of leaf epidermal cells of WT plants treated with Lat-B (A) or CD (E). Endocytotic vesicles forming funnel-like structures are seen in growth lobes (arrows). (B–D) GFP-Atrac10CA leaf epidermal cells treated with Lat-B. The Lat-B treatments induced formation of vesicles reaching diameters of ∼40 μm, displaying colocalization of FM4-64 and GFP-Atrac10CA (arrow). (F–H) GFP-Atrac10CA leaf epidermis cells treated with CD. Similar to Lat-B, CD treatments induced formation of vesicles at diameters of ∼40 μm; large endocytotic vesicles labeled with both FM4-64 and GFP-Atrac10CA. Cells were visualized with CLSM. Green indicates GFP (C and D), red indicates FM4-64 (A, B, E, and F), and yellow indicates colocalization of GFP and FM4-64 in overlay images (D and H). Bars, 20 μm.

Similar articles

Cited by

References

    1. Adamo, J. E., Moskow, J. J., Gladfelter, A. S., Viterbo, D., Lew, D. J., and Brennwald, P. J. (2001). Yeast Cdc42 functions at a late step in exocytosis, specifically during polarized growth of the emerging bud. J. Cell Biol. 155, 581-592. - PMC - PubMed
    1. Adamo, J. E., Rossi, G., and Brennwald, P. (1999). The Rho GTPase Rho3 has a direct role in exocytosis that is distinct from its role in actin polarity. Mol. Biol. Cell 10, 4121-4133. - PMC - PubMed
    1. Agrawal, G. K., Iwahashi, H., and Rakwal, R. (2003). Small GTPase `Rop': molecular switch for plant defense responses. FEBS Lett. 546, 173-180. - PubMed
    1. Baluska, F., Hlavacka, A., Samaj, J., Palme, K., Robinson, D. G., Matoh, T., McCurdy, D. W., Menzel, D., and Volkmann, D. (2002). F-actin-dependent endocytosis of cell wall pectins in meristematic root cells. Insights from brefeldin A-induced compartments. Plant Physiol. 130, 422-431. - PMC - PubMed
    1. Basu, D., El-Assal Sel, D., Le, J., Mallery, E. L., and Szymanski, D. B. (2004). Interchangeable functions of Arabidopsis PIROGI and the human WAVE complex subunit SRA1 during leaf epidermal development. Development 131, 4345-4355. - PubMed

Publication types

MeSH terms