. 2005 Feb;115(2):326-38.
doi: 10.1172/JCI22326.

Clonally expanded novel multipotent stem cells from human bone marrow regenerate myocardium after myocardial infarction

Affiliations

Clonally expanded novel multipotent stem cells from human bone marrow regenerate myocardium after myocardial infarction

Young-sup Yoon et al. J Clin Invest. 2005 Feb.

Abstract

We have identified a subpopulation of stem cells within adult human BM, isolated at the single-cell level, that self-renew without loss of multipotency for more than 140 population doublings and exhibit the capacity for differentiation into cells of all 3 germ layers. Based on surface marker expression, these clonally expanded human BM-derived multipotent stem cells (hBMSCs) do not appear to belong to any previously described BM-derived stem cell population. Intramyocardial transplantation of hBMSCs after myocardial infarction resulted in robust engraftment of transplanted cells, which exhibited colocalization with markers of cardiomyocyte (CMC), EC, and smooth muscle cell (SMC) identity, consistent with differentiation of hBMSCs into multiple lineages in vivo. Furthermore, upregulation of paracrine factors including angiogenic cytokines and antiapoptotic factors, and proliferation of host ECs and CMCs, were observed in the hBMSC-transplanted hearts. Coculture of hBMSCs with CMCs, ECs, or SMCs revealed that phenotypic changes of hBMSCs result from both differentiation and fusion. Collectively, the favorable effect of hBMSC transplantation after myocardial infarction appears to be due to augmentation of proliferation and preservation of host myocardial tissues as well as differentiation of hBMSCs for tissue regeneration and repair. To our knowledge, this is the first demonstration that a specific population of multipotent human BM-derived stem cells can induce both therapeutic neovascularization and endogenous and exogenous cardiomyogenesis.


Figures
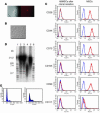
Figure 1
Figure 1
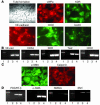
Characteristics of hBMSCs. (A) Phase-contrast and fluorescent images show a single cell per well. Original magnification, ×400. (BD) Cells were analyzed with a FACStar flow cytometer. (B) Morphologically, most hBMSCs demonstrate round morphology with a cell size of less than 15 μm in diameter. Scale bar: 100 μm. (C) Clonally isolated hBMSCs cultured for 120 PDs were labeled with PE- or FITC-conjugated Abs against human CD29, CD44, CD73, CD105, CD90, or CD117, or Ig isotype controls. Blue lines, control Ig; red lines, specific Ab. Clonally isolated hBMSCs showed only minimal expression or no expression (<3%) of CD90, CD105, and CD117 (C). In contrast, the purchased MSCs expressed significantly higher levels of CD29, CD44, CD73, CD105, CD90, and CD117. (D) Mean TRF length of hBMSCs cultured for 5 PDs (lane 2) and 120 PDs (lane 3). No difference in mean TRF is shown. Human umbilical vein ECs (lane 4) and immortalized cell lines with high telomere length, provided by the Roche Diagnostics Corp. (lane 5), were used as controls. Lanes 1 and 6, molecular weight standards. (E) DNA ploidy analysis. hBMSCs were stained with propidium iodide and subjected to FACS analysis. Representative examples of hBMSCs cultured for 20 (left panel) and 140 (right panel) PDs demonstrate no evidence of overdiploid DNA content. Similar experiments were performed at least 3 times (AE).
Figure 2
Figure 2
In vitro differentiation of hBMSCs into EC and SMC lineages. (A) Hoffman phase-contrast image (upper left panel) 5 days after culture with DMEM in gelatin-coated glass chambers shows that hBMSCs have formed typical vascular tubelike structures. Immunofluorescent imaging demonstrates that hBMSCs express EC-specific proteins such as vWFa, KDR, VE-cadherin, CD31, and ULEX after culturing in EC differentiation media for 14 days. (B) RT-PCR analysis using EC-specific primers VE-cadherin, CD34, KDR, Tie2, and CD31 also confirms the differentiation of hBMSCs into EC phenotypes. Lane 1, size marker; lane 2, before differentiation; lane 3, induced differentiation; lane 4, positive control. (C) hBMSCs cultured in 2% DMEM containing PDGF-BB for 14 days demonstrate the expression of SMC-specific proteins α-SMA and calponin by immunofluorescent staining. (D) RT-PCR analysis shows that SMC-specific genes PDGFR-β, α-SMA, SM22α, and SM1 are only expressed after induction of differentiation. Lane 1, size marker; lane 2, before differentiation; lane 3, induced differentiation; lane 4, positive control. The heavy band in the lanes of the size markers in B and D represents 600 bp. Scale bar: 100 μm.
Figure 3
Figure 3
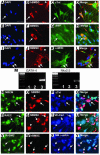
In vitro differentiation and fusion of hBMSCs to CMCs, ECs, and SMCs. (AL) Coculture of hBMSCs with NRCMs. On day 3, DiI-labeled hBMSCs were added to the cultured NRCMs at a 1:4 ratio. IF images show cocultured DiI-labeled hBMSCs (B, F, and J) as red and NRCMs stained with CMC-specific proteins cTnI (C), ANP (G), and α-MHC (K) as green. Double-fluorescent cells in the merged images (D, H, and L) indicate that a subpopulation of hBMSCs exhibit CMC phenotypic markers (arrows). Arrowheads in B, D, J, and L indicate nontransdifferentiated hBMSCs. DAPI nuclear counterstaining (A, E, and I) shows no overlap of nuclei. mRNA expression of cardiac transcription factors was evaluated by RT-PCR (M). Before coculture, GATA-4 and Nkx2.5 were not expressed in hBMSC (lane 1) and NRCM (lane 2) cultures. Coculture (lane 3) induced de novo expression of GATA-4 and Nkx2.5. (NQ) Coculture of prelabeled NRCMs and hBMSCs for investigation of cell fusion. NRCMs were labeled with the green fluorescence dye CFDA-SE (N) and DiI-labeled hBMSCs (O). Seven days after coculture, cells were stained for cTnI expression (blue fluorescence) (P). In the IF images (NQ), triple-fluorescent cells (arrows) are fusion cells expressing cTnI protein. An hBMSC that has differentiated into CMC lineage is illustrated by red and blue fluorescence without green fluorescence (arrowheads). (RY) To determine the contribution of fusion and differentiation to phenotypic changes of hBMSCs into ECs (RU) or SMCs (VY), CFDA-SE–labeled RAECs or RVSMCs were cocultured with DiI-labeled hBMSCs. Cells were stained with VE-cadherin or α-SMA (blue fluorescence). Arrows in RU indicate fused RAECs (green) and hBMSCs (red) that express VE-cadherin. Arrowheads in RU illustrate ECs differentiated from hBMSCs. Arrows in VY indicate fused RVSMCs (green) and hBMSCs (red) that express α-SMA. Scale bar in AL: 50 μm; scale bar in NY: 100 μm.
Figure 4
Figure 4
Transplantation of hBMSCs improves cardiac function, increases capillary and CMC density, and decreases myocardial fibrosis in a rat model of MI. (AD) Echocardiographic parameters 4 weeks after MI and cell transplantation show smaller LVEDD and LVESD, better fractional shortening (FS), and lower WMSI in the hBMSC-transplanted rats than in the TBMC- and PBS-treated rats, indicating improved cardiac function. (E and F) Invasive hemodynamic measurements using a Millar Instruments Inc. catheter 4 weeks after hBMSC transplantation. LV systolic pressure (LVSP) (E) and +dP/dtmax and –dP/dtmax (dP/dtmin) (F) were significantly augmented in the hBMSC-transplanted rats compared with the control groups. LVEDP, LV end-diastolic pressure. *P < 0.05, **P < 0.01. (G and H) Capillary (G) and CMC (H) density measured after CD31 and H&E staining, respectively, was significantly higher in hBMSC-transplanted hearts than in TBMC- and PBS-treated hearts. **P < 0.01 vs. TBMC and PBS. (I) Percentage circumferential fibrosis measured in Masson’s trichrome–stained sections was significantly smaller in hBMSC-transplanted hearts. **P < 0.01 vs. TBMC and PBS.
Figure 5
Figure 5
Engraftment and multilineage differentiation of transplanted hBMSCs in infarcted myocardium. (AD) Engraftment of DiI-labeled hBMSCs and TBMCs into infarcted myocardium. Numerous hBMSCs (red fluorescence) (A) are engrafted into the infarct and peri-infarct region of myocardium at 4 weeks after transplantation. In contrast, considerably fewer TBMCs (red fluorescence) are observed, mostly within the infarct area (C). B and D are the Hoffman images of A and C, respectively, showing the localization of engrafted cells. (E and F) Immunophenotypic characterization of hBMSCs that have differentiated into CMCs. Myocardial samples 4 weeks after transplantation were stained for cTnI (E) and ANP (F) (each detected with FITC-labeled secondary Ab). Transplanted DiI-hBMSCs expressed both markers and were indistinguishable from host CMCs. (G and H) Myocardial sections stained with ILB4, an EC marker, demonstrate that DiI-hBMSCs are colocalized with vascular ECs in both the infarct (G) and the peri-infarct (H) area (arrows). (I) Myocardial sections stained with α-SMA illustrate DiI-hBMSC colocalized with vascular SMCs (arrows). (JL) FISH on hBMSC-transplanted hearts. FISH with α-sarcomeric actinin staining (J) demonstrates that transplanted hBMSCs shown in FISH-positive red fluorescence express a CMC phenotype (green fluorescence). FISH with ILB4 staining (K) demonstrates that transplanted hBMSCs shown in FISH-positive red fluorescence exhibit a vascular EC phenotype (green fluorescence). FISH with α-SMA staining (L) reveals that transplanted hBMSCs shown in FISH-positive red fluorescence express an SMC phenotype (green fluorescence). White arrows indicate FISH-positive cells stained with CMC, EC, or SMC markers; yellow arrows indicate FISH-positive cells not stained with CMC, EC, or SMC markers. Scale bars in AI: 100 μm; scale bars in JL: 50 μm.
Figure 6
Figure 6
hBMSC transplantation augments myocardial cell proliferation, reduces myocardial apoptosis, and affects multiple paracrine factors. (AF) BrdU imunohistochemistry. (AD) Numerous BrdU-positive cells (green fluorescence) were observed in both host myocardial cells and transplanted cells in hBMSC-transplanted hearts (D), in contrast to TBMC-treated (E) or PBS-treated (F) hearts. (GJ) Double staining for BrdU (H) and ILB4 (I) shows proliferating capillary ECs (arrows). (KN) Double staining for BrdU (L) and cTnI (M) shows proliferating cells (arrows) (N) in hBMSC-transplanted hearts. (OQ) hBMSC-treated (O), TBMC-treated (P), or PBS-treated (Q) myocardium with anti–α-sarcomeric actinin mAb and TUNEL to identify apoptotic myocardial cells (green fluorescence). Fewer apoptotic cells are evident in hBMSC-transplanted hearts compared with those receiving TBMCs or PBS. (R and S) Staining with mAb against α-sarcomeric actinin (red) and TUNEL (green) demonstrates CMC apoptosis (arrows) in PBS-injected heart tissue. (T and U) Staining with ILB4 (red) and TUNEL (green) demonstrates EC apoptosis (arrows) in the PBS-injected heart. Scale bar: 100 μm (AF and OU), 50 μm (GN). (VY) Heart samples (n = 3 per group) were harvested 4 weeks after MI and cell transplantation. Quantification of protein expression normalized to tubulin expression (V) demonstrates significant upregulation of VEGF, bFGF, and HGF in hBMSC-transplanted hearts compared with TBMC- or PBS-injected hearts. mRNA expression of angiogenic cytokines (W), cardiac transcription factors (X), and other factors (IGF and SDF1α) (Y) normalized to GAPDH expression shows significant upregulation of all factors in the hBMSC-transplanted hearts. Data were obtained from 3 separate experiments and are presented as amount relative to controls. *P < 0.05, **P < 0.01 vs. PBS; +P < 0.01, ++P < 0.001, #P < 0.0001 vs. TBMC and PBS. Ang, angiopoietin.

Similar articles

Cited by

References

    1. Braunwald E, Bristow MR. Congestive heart failure: fifty years of progress. Circulation. 2000;102:IV14–IV23. - PubMed
    1. Pfeffer MA. Left ventricular remodeling after acute myocardial infarction. Annu. Rev. Med. 1995;46:455–466. - PubMed
    1. Brazelton TR, Rossi FM, Keshet GI, Blau HM. From marrow to brain: expression of neuronal phenotypes in adult mice. Science. 2000;290:1775–1779. - PubMed
    1. Mezey E, Chandross KJ, Harta G, Maki RA, McKercher SR. Turning blood into brain: cells bearing neuronal antigens generated in vivo from bone marrow. Science. 2000;290:1779–1782. - PubMed
    1. Ferrari G, et al. Muscle regeneration by bone marrow-derived myogenic progenitors. Science. 1998;279:1528–1530. - PubMed

Publication types

MeSH terms