IL-23 drives a pathogenic T cell population that induces autoimmune inflammation
- PMID: 15657292
- PMCID: PMC2212798
- DOI: 10.1084/jem.20041257
IL-23 drives a pathogenic T cell population that induces autoimmune inflammation
Abstract
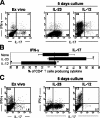
Interleukin (IL)-23 is a heterodimeric cytokine composed of a unique p19 subunit, and a common p40 subunit shared with IL-12. IL-12 is important for the development of T helper (Th)1 cells that are essential for host defense and tumor suppression. In contrast, IL-23 does not promote the development of interferon-gamma-producing Th1 cells, but is one of the essential factors required for the expansion of a pathogenic CD4(+) T cell population, which is characterized by the production of IL-17, IL-17F, IL-6, and tumor necrosis factor. Gene expression analysis of IL-23-driven autoreactive T cells identified a unique expression pattern of proinflammatory cytokines and other novel factors, distinguishing them from IL-12-driven T cells. Using passive transfer studies, we confirm that these IL-23-dependent CD4(+) T cells are highly pathogenic and essential for the establishment of organ-specific inflammation associated with central nervous system autoimmunity.
Figures


Similar articles
-
Pathophysiology of interleukin-23 in experimental autoimmune encephalomyelitis.Drug News Perspect. 2006 Mar;19(2):77-83. doi: 10.1358/dnp.2006.19.2.977443. Drug News Perspect. 2006. PMID: 16628262 Review.
-
IL-12- and IL-23-induced T helper cell subsets: birds of the same feather flock together.J Exp Med. 2005 Jan 17;201(2):169-71. doi: 10.1084/jem.20042279. J Exp Med. 2005. PMID: 15657286 Free PMC article.
-
Interleukin-23 rather than interleukin-12 is the critical cytokine for autoimmune inflammation of the brain.Nature. 2003 Feb 13;421(6924):744-8. doi: 10.1038/nature01355. Nature. 2003. PMID: 12610626
-
Induction of experimental autoimmune encephalomyelitis in IL-12 receptor-beta 2-deficient mice: IL-12 responsiveness is not required in the pathogenesis of inflammatory demyelination in the central nervous system.J Immunol. 2003 Feb 15;170(4):2153-60. doi: 10.4049/jimmunol.170.4.2153. J Immunol. 2003. PMID: 12574388
-
Stepwise regulation of TH1 responses in autoimmunity: IL-12-related cytokines and their receptors.Inflamm Bowel Dis. 2005 Aug;11(8):755-64. doi: 10.1097/01.mib.0000172808.03877.4d. Inflamm Bowel Dis. 2005. PMID: 16043992 Review.
Cited by
-
Predominance of activated, clonally expanded T helper type 17 cells within the CD4+ T cell population in psoriatic lesions.Clin Exp Immunol. 2013 Jul;173(1):38-46. doi: 10.1111/cei.12086. Clin Exp Immunol. 2013. PMID: 23607572 Free PMC article.
-
The suppressive effect of IL-27 on encephalitogenic Th17 cells induced by multiwalled carbon nanotubes reduces the severity of experimental autoimmune encephalomyelitis.CNS Neurosci Ther. 2013 Sep;19(9):682-7. doi: 10.1111/cns.12121. Epub 2013 Jun 3. CNS Neurosci Ther. 2013. PMID: 23731464 Free PMC article.
-
Der p1 and Der p2-Specific T Cells Display a Th2, Th17, and Th2/Th17 Phenotype in Atopic Dermatitis.J Invest Dermatol. 2015 Sep;135(9):2324-2327. doi: 10.1038/jid.2015.162. Epub 2015 Apr 28. J Invest Dermatol. 2015. PMID: 25918982 No abstract available.
-
The mode of action of IL-23 in experimental inflammatory arthritic pain and disease.Arthritis Res Ther. 2024 Aug 6;26(1):148. doi: 10.1186/s13075-024-03380-z. Arthritis Res Ther. 2024. PMID: 39107827 Free PMC article.
-
Single-Cell Transcriptomics Identifies Brain Endothelium Inflammatory Networks in Experimental Autoimmune Encephalomyelitis.Neurol Neuroimmunol Neuroinflamm. 2022 Nov 29;10(1):e200046. doi: 10.1212/NXI.0000000000200046. Print 2023 Jan. Neurol Neuroimmunol Neuroinflamm. 2022. PMID: 36446612 Free PMC article.
References
-
- Cua, D.J., J. Sherlock, Y. Chen, C.A. Murphy, B. Joyce, B. Seymour, L. Lucian, W. To, S. Kwan, T. Churakova, et al. 2003. Interleukin-23 rather than interleukin-12 is the critical cytokine for autoimmune inflammation of the brain. Nature. 421:744–748. - PubMed
-
- Oppmann, B., R. Lesley, B. Blom, J.C. Timans, Y. Xu, B. Hunte, F. Vega, N. Yu, J. Wang, K. Singh, et al. 2000. Novel p19 protein engages IL-12p40 to form a cytokine, IL-23, with biological activities similar as well as distinct from IL-12. Immunity. 13:715–725. - PubMed
-
- O'Garra, A., and N. Arai. 2000. The molecular basis of T helper 1 and T helper 2 cell differentiation. Trends Cell Biol. 10:542–550. - PubMed
-
- Shtrichman, R., and C.E. Sanuel. 2001. The role of gamma interferon in antimicrobial immunity. Curr. Opin. Microbiol. 4:251–259. - PubMed
Publication types
MeSH terms
Substances
LinkOut - more resources
Full Text Sources
Other Literature Sources
Molecular Biology Databases
Research Materials

