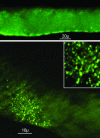
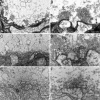
Vesicular reuptake inhibition by a synaptotagmin I C2B domain antibody at the squid giant synapse
- PMID: 15591349
- PMCID: PMC539760
- DOI: 10.1073/pnas.0408200101
Vesicular reuptake inhibition by a synaptotagmin I C2B domain antibody at the squid giant synapse
Abstract
Synaptotagmin (Syt) I, a ubiquitous synaptic vesicle protein, comprises a transmembrane region and two C2 domains. The C2 domains, which have been shown to be essential for both synaptic vesicle exocytosis and endocytosis, are also seen as the Ca(2+) sensors in synaptic vesicular release. In a previous study, we reported that a polyclonal antibody raised against the squid (Loligo pealei) Syt I C2B domain, while inhibiting vesicular endocytosis, was synaptic release neutral at the squid giant synapse. Recent reports concerning the C2B requirements for synaptic release prompted us to readdress the role of C2B in squid giant synapse function. Presynaptic injection of another anti-Syt I-C2B antibody (using recombinant whole C2B domain expressed in mammalian cell culture as an antigen) into the presynaptic terminal reproduced our previous results, i.e., reduction of vesicular endocytosis without affecting synaptic release. This set of results addresses the issue of the geometrical arrangement of the Ca(2+) sensor, allowing the C2B domain antibody to restrict Ca(2+)-dependent C2B self-oligomerization without modifying the Ca(2+)-dependent release process.
Figures


Similar articles
-
Role of the C2B domain of synaptotagmin in vesicular release and recycling as determined by specific antibody injection into the squid giant synapse preterminal.Proc Natl Acad Sci U S A. 1995 Nov 7;92(23):10708-12. doi: 10.1073/pnas.92.23.10708. Proc Natl Acad Sci U S A. 1995. PMID: 7479869 Free PMC article.
-
Roles of synaptotagmin C2 domains in neurotransmitter secretion and inositol high-polyphosphate binding at mammalian cholinergic synapses.Neuroscience. 1997 Apr;77(4):937-43. doi: 10.1016/s0306-4522(96)00572-6. Neuroscience. 1997. PMID: 9130775
-
Mutations in the second C2 domain of synaptotagmin disrupt synaptic transmission at Drosophila neuromuscular junctions.J Comp Neurol. 2001 Jul 16;436(1):4-16. J Comp Neurol. 2001. PMID: 11413542
-
The C2 domains of synaptotagmin--partners in exocytosis.Trends Biochem Sci. 2004 Mar;29(3):143-51. doi: 10.1016/j.tibs.2004.01.008. Trends Biochem Sci. 2004. PMID: 15003272 Review.
-
Role of synaptotagmin, a Ca2+ and inositol polyphosphate binding protein, in neurotransmitter release and neurite outgrowth.Chem Phys Lipids. 1999 Apr;98(1-2):59-67. doi: 10.1016/s0009-3084(99)00018-3. Chem Phys Lipids. 1999. PMID: 10358928 Review.
Cited by
-
Developmental shift to a mechanism of synaptic vesicle endocytosis requiring nanodomain Ca2+.Nat Neurosci. 2010 Jul;13(7):838-44. doi: 10.1038/nn.2576. Epub 2010 Jun 20. Nat Neurosci. 2010. PMID: 20562869 Free PMC article.
-
Molecular basis of synaptic vesicle cargo recognition by the endocytic sorting adaptor stonin 2.J Cell Biol. 2007 Dec 31;179(7):1497-510. doi: 10.1083/jcb.200708107. J Cell Biol. 2007. PMID: 18166656 Free PMC article.
-
Synaptic transmission at retinal ribbon synapses.Prog Retin Eye Res. 2005 Nov;24(6):682-720. doi: 10.1016/j.preteyeres.2005.04.002. Prog Retin Eye Res. 2005. PMID: 16027025 Free PMC article. Review.
-
Distinct roles of the C2A and the C2B domain of the vesicular Ca2+ sensor synaptotagmin 9 in endocrine beta-cells.Biochem J. 2007 May 1;403(3):483-92. doi: 10.1042/BJ20061182. Biochem J. 2007. PMID: 17263688 Free PMC article.
-
Role of Rab27 in synaptic transmission at the squid giant synapse.Proc Natl Acad Sci U S A. 2008 Oct 14;105(41):16003-8. doi: 10.1073/pnas.0804825105. Epub 2008 Oct 7. Proc Natl Acad Sci U S A. 2008. PMID: 18840683 Free PMC article.
References
-
- Schiavo, G., Osborne, S. L. & Sgouros, J. G. (1998) Biochem. Biophys. Res. Commun. 248, 1-8. - PubMed
-
- Marquèze, B., Berton, F. & Seagar, M. (2000) Biochimie 82, 409-420. - PubMed
-
- Südhof, T. C. (2002) J. Biol. Chem. 277, 7629-7632. - PubMed
-
- Chapman, E. R. (2002) Nat. Rev. Mol. Cell Biol. 3, 498-508. - PubMed
-
- Fukuda, M. (2003) Recent Res. Dev. Chem. Phys. Lipids 1, 15-51.
Publication types
MeSH terms
Substances
LinkOut - more resources
Full Text Sources
Miscellaneous

