

Mulan: multiple-sequence local alignment and visualization for studying function and evolution
- PMID: 15590941
- PMCID: PMC540288
- DOI: 10.1101/gr.3007205
Mulan: multiple-sequence local alignment and visualization for studying function and evolution
Abstract
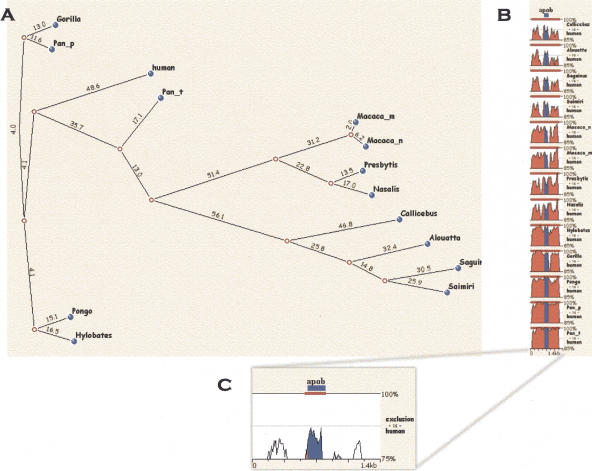
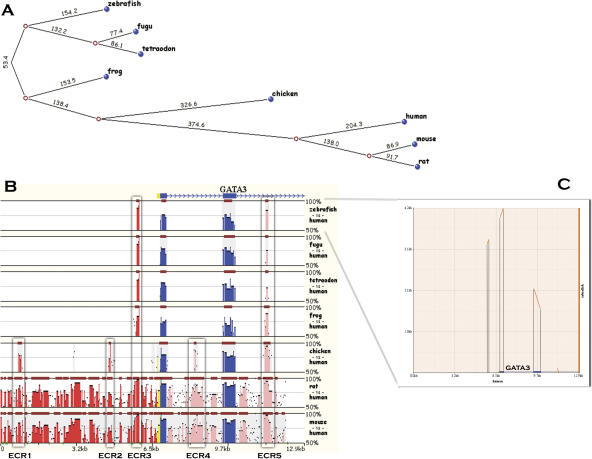
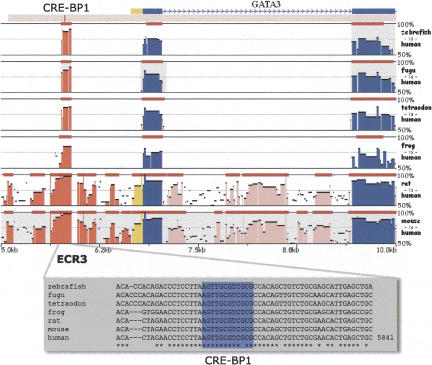
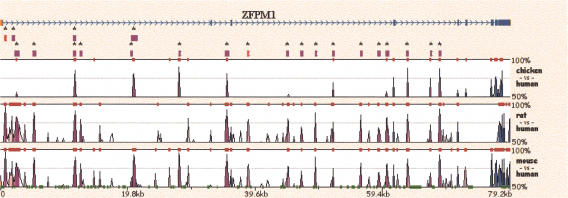
Multiple-sequence alignment analysis is a powerful approach for understanding phylogenetic relationships, annotating genes, and detecting functional regulatory elements. With a growing number of partly or fully sequenced vertebrate genomes, effective tools for performing multiple comparisons are required to accurately and efficiently assist biological discoveries. Here we introduce Mulan (http://mulan.dcode.org/), a novel method and a network server for comparing multiple draft and finished-quality sequences to identify functional elements conserved over evolutionary time. Mulan brings together several novel algorithms: the TBA multi-aligner program for rapid identification of local sequence conservation, and the multiTF program for detecting evolutionarily conserved transcription factor binding sites in multiple alignments. In addition, Mulan supports two-way communication with the GALA database; alignments of multiple species dynamically generated in GALA can be viewed in Mulan, and conserved transcription factor binding sites identified with Mulan/multiTF can be integrated and overlaid with extensive genome annotation data using GALA. Local multiple alignments computed by Mulan ensure reliable representation of short- and large-scale genomic rearrangements in distant organisms. Mulan allows for interactive modification of critical conservation parameters to differentially predict conserved regions in comparisons of both closely and distantly related species. We illustrate the uses and applications of the Mulan tool through multispecies comparisons of the GATA3 gene locus and the identification of elements that are conserved in a different way in avians than in other genomes, allowing speculation on the evolution of birds. Source code for the aligners and the aligner-evaluation software can be freely downloaded from http://www.bx.psu.edu/miller_lab/.
Figures


Similar articles
-
Mulan: multiple-sequence alignment to predict functional elements in genomic sequences.Methods Mol Biol. 2007;395:237-54. Methods Mol Biol. 2007. PMID: 17993678 Free PMC article.
-
Dcode.org anthology of comparative genomic tools.Nucleic Acids Res. 2005 Jul 1;33(Web Server issue):W56-64. doi: 10.1093/nar/gki355. Nucleic Acids Res. 2005. PMID: 15980535 Free PMC article.
-
ECR Browser: a tool for visualizing and accessing data from comparisons of multiple vertebrate genomes.Nucleic Acids Res. 2004 Jul 1;32(Web Server issue):W280-6. doi: 10.1093/nar/gkh355. Nucleic Acids Res. 2004. PMID: 15215395 Free PMC article.
-
Computation and analysis of genomic multi-sequence alignments.Annu Rev Genomics Hum Genet. 2007;8:193-213. doi: 10.1146/annurev.genom.8.080706.092300. Annu Rev Genomics Hum Genet. 2007. PMID: 17489682 Review.
-
Multiple sequence alignment: in pursuit of homologous DNA positions.Genome Res. 2007 Feb;17(2):127-35. doi: 10.1101/gr.5232407. Genome Res. 2007. PMID: 17272647 Review.
Cited by
-
Retinoid X receptors orchestrate osteoclast differentiation and postnatal bone remodeling.J Clin Invest. 2015 Feb;125(2):809-23. doi: 10.1172/JCI77186. Epub 2015 Jan 9. J Clin Invest. 2015. PMID: 25574839 Free PMC article.
-
FOSL2 promotes leptin gene expression in human and mouse adipocytes.J Clin Invest. 2012 Mar;122(3):1010-21. doi: 10.1172/JCI58431. Epub 2012 Feb 13. J Clin Invest. 2012. PMID: 22326952 Free PMC article.
-
Evolutionary genomics of the recently duplicated amphioxus Hairy genes.Int J Biol Sci. 2006;2(2):66-72. doi: 10.7150/ijbs.2.66. Epub 2006 Apr 10. Int J Biol Sci. 2006. PMID: 16733536 Free PMC article.
-
The Phylogeny, Ontogeny, and Organ-specific Differentiation of Macrophages in the Developing Intestine.Newborn (Clarksville). 2022 Oct-Dec;1(4):340-355. doi: 10.5005/jp-journals-11002-0044. Epub 2022 Dec 23. Newborn (Clarksville). 2022. PMID: 36698382 Free PMC article.
-
A global role for EKLF in definitive and primitive erythropoiesis.Blood. 2006 Apr 15;107(8):3359-70. doi: 10.1182/blood-2005-07-2888. Epub 2005 Dec 27. Blood. 2006. PMID: 16380451 Free PMC article.
References
-
- Andl, T., Ahn, K., Kairo, A., Chu, E.Y., Wine-Lee, L., Reddy, S.T., Croft, N.J., Cebra-Thomas, J.A., Metzger, D., Chambon, P., et al. 2004. Epithelial Bmpr1a regulates differentiation and proliferation in postnatal hair follicles and is essential for tooth development. Development 131: 2257-2268. - PubMed
-
- Boffelli, D., McAuliffe, J., Ovcharenko, D., Lewis, K.D., Ovcharenko, I., Pachter, L., and Rubin, E.M. 2003. Phylogenetic shadowing of primate sequences to find functional regions of the human genome. Science 299: 1391-1394. - PubMed
Web site references
-
- http://www.bx.psu.edu/miller_lab/; Source code for the aligners and the aligner-evaluation software.
-
- http://mulan.dcode.org; Mulan.
-
- http://rvista.dcode.org/; rVista 2.0.
-
- http://www.jgi.doe.gov/; Joint Genome Institute sequencing facility.
Publication types
MeSH terms
Substances
Grants and funding
LinkOut - more resources
Full Text Sources
Other Literature Sources
Miscellaneous