. 2004 Nov 24;23(23):4538-49.
doi: 10.1038/sj.emboj.7600471. Epub 2004 Nov 18.

Enterotoxigenic Escherichia coli vesicles target toxin delivery into mammalian cells

Affiliations

Enterotoxigenic Escherichia coli vesicles target toxin delivery into mammalian cells

Nicole C Kesty et al. EMBO J. .

Abstract

Enterotoxigenic Escherichia coli (ETEC) is a prevalent cause of traveler's diarrhea and infant mortality in third-world countries. Heat-labile enterotoxin (LT) is secreted from ETEC via vesicles composed of outer membrane and periplasm. We investigated the role of ETEC vesicles in pathogenesis by analyzing vesicle association and entry into eukaryotic cells. Fluorescently labeled vesicles from LT-producing and LT-nonproducing strains were compared in their ability to bind adrenal and intestinal epithelial cells. ETEC-derived vesicles, but not control nonpathogen-derived vesicles, associated with cells in a time-, temperature-, and receptor-dependent manner. Vesicles were visualized on the cell surface at 4 degrees C and detected intracellularly at 37 degrees C. ETEC vesicle endocytosis depended on cholesterol-rich lipid rafts. Entering vesicles partially colocalized with caveolin, and the internalized vesicles accumulated in a nonacidified compartment. We conclude that ETEC vesicles serve as specifically targeted transport vehicles that mediate entry of active enterotoxin and other bacterial envelope components into host cells. These data demonstrate a role in virulence for ETEC vesicles.


Figures
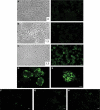
Figure 1
Figure 1
Interaction of ETEC vesicles with Y1 adrenal cells depends on the LT receptor GM1 and is temperature sensitive. FITC-ETEC vesicles were incubated with Y1 cells at 37°C for 2 h, (A), 4 h (B), or 8 h (C) and visualized by phase contrast (left panel) and confocal microscopy (right panel). Toxicity scores (see Materials and methods) are indicated in the left panels. (D, E) Magnified confocal microscopy of isolated Y1 cells following incubation with FITC-ETEC vesicles for 8 h. Confocal microscopy of Y1 cells incubated for 8 h with FITC-HB101 vesicles at 37°C (F), FITC-ETEC vesicles pretreated with GM1 and incubated for 8 h at 37°C (G), or FITC-ETEC vesicles incubated for 8 h at 4°C (H). Size bars apply to all panels in each section (A–C, 20 μm; D, E, 5 μm; F–H, 20 μm).
Figure 2
Figure 2
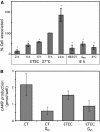
ETEC vesicle association with HT29 colorectal, epithelial cells is GM1-, time-, and temperature-dependent and causes an increase in cAMP. (A) Cell-associated fluorescence was quantitated for HT29 cells incubated with FITC-labeled vesicles. Left, time course for FITC-ETEC vesicle incubations. Right, FITC-HB101 vesicles incubated for 8 h at 37°C; FITC-ETEC vesicles preincubated with GM1 for 8 h at 37°C; or FITC-ETEC vesicles incubated for 8 h at 4°C, as indicated. Data are represented as the percent of cell-associated fluorescence relative to the 8 h incubations with untreated FITC-ETEC vesicles±s.e.m. Significant difference was determined using Student's t-test. *Treatment is significantly different from 8 h treatment with FITC-ETEC vesicles (P-value <0.001), n>9. (B) Concentration of cAMP (pmol/well) produced by HT29 cells incubated for 4 h with CT, CT preincubated with GM1, ETEC vesicles, or ETEC vesicles preincubated with GM1. n=3.
Figure 3
Figure 3
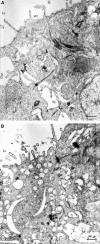
ETEC vesicle association with HT29 cells causes vacuolization. Electron microscopy of thin sections of HT29 cells (A) and HT29 cells incubated with 10 μg ETEC vesicles for 8 h (B). Crescent-shaped vacuoles (CV) were apparent in both vesicle-treated and untreated cells. Other subcellular structures include microvilli (MV), toxin-induced vacuoles (Vac), and tight junction desmosomes (TJ). Ex designates the extracellular space. Ves designates possible extracellular ETEC vesicles. Possible intracellular vesicles are visible in and around vacuoles. Size bar indicates 5 μm.
Figure 4
Figure 4
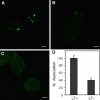
LT mediates the interaction of E. coli vesicles with HT29 cells. Confocal microscopy of HT29 cells incubated at 37°C for 8 h with MC4100 Δhns/GSP/LT (LT+) FITC-vesicles (A), GM1-pretreated LT+ FITC-vesicles (B), or FITC-MC4100 Δhns/GSP (LT−) FITC-vesicles (C). Size bars indicate 5 μm. (D) Cell-associated fluorescence was quantitated for HT29 cells incubated with FITC-MC4100 Δhns/GSP/LT vesicles (LT+) and FITC-MC4100 Δhns/GSP vesicles (LT−) for 8 h at 37°C. Data are represented as the percent cell-associated fluorescence relative to the incubations with FITC-MC4100 Δhns/GSP/LT vesicles±s.e.m. Significant difference was determined using Student's t-test. *Treatment is significantly different (P-value <0.001), n>6.
Figure 5
Figure 5
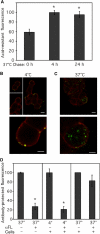
ETEC vesicles are internalized by HT29 cells. (A) HT29 cells were incubated with FITC-ETEC vesicles at 4°C (‘pulse') and fluorescence was measured in buffer at pH 4 and pH 8 after incubations for 0, 4, or 24 h at 37°C (‘chase'). The percent acid-resistant fluorescence represents the ratio of fluorescence at pH 4 as compared to the fluorescence at pH 8±s.e.m. Significant difference was determined using unpaired Student's t-test. *Acid-resistant fluorescence after the 4 and 24 h chase is significantly different from acid-resistant fluorescence after the pulse (0 h) (P<0.003), n>5. HT29 cells were incubated with FITC-ETEC vesicles for 8 h at 4°C (B) or 37°C (C) before incubation with WGA at 4°C to label the exterior of cells. Yellow indicates colocalization of vesicles (green) with WGA (red) at the cell surface. Size bars indicate 20 μm in the upper panels and 5 μm in the lower panels. (D) First panel: 11 ng of FITC-ETEC vesicles (equivalent to the amount of vesicles bound to HT29 cells after an 8 h incubation) was incubated without (−) and with (+) anti-fluorescein antibody (αFL) for 1 h in the absence of cells (−cells). HT29 cells incubated with FITC-ETEC vesicles for 8 h at 4°C (middle panel) and 37°C (last panel) before incubation without (−) and with (+) anti-fluorescein antibody for 1 h. Data are represented as the percent fluorescence relative to incubations without antibody for each treatment±s.e.m. Significant difference was determined using Student's t-test. *Treatment is significantly different from treatment without quenching (P<0.001), n>6.
Figure 6
Figure 6
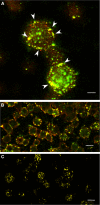
ETEC vesicle components other than LT are bound to and within HT29 cells. Confocal microscopy of Y1 cells incubated for 8 h at 37°C with 1 μg FITC-ETEC vesicles (green), fixed, and treated with anti-E. coli antibody detected using rhodamine-labeled anti-rabbit antibody (red). (A, B) Intact cells exhibit distinct internalized FITC vesicles (green) and FITC vesicles on the cell surface colabeled with rhodamine antibody (arrowheads, yellow). (C) Cells permeabilized with detergent prior to antibody labeling demonstrate rhodamine and FITC colocalization (yellow) of all cell-associated vesicles. Size bars represent 10 μm (A) and 20 μm (B, C).
Figure 7
Figure 7
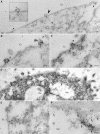
Thin-section electron microscopy of ETEC vesicle binding and internalization by HT29 cells. Immunogold electron microscopy of thin sections of HT29 cells incubated for 8 h at 37°C with ETEC vesicles, treated with anti-E. coli antibody (A–D, F) or anti-LPS antibody (E), and detected with gold-labeled anti-rabbit antibody. Gold-labeled vesicles were detected bound to the exterior (Ex) of cells (arrowheads) and in internal compartments (arrows), often near vacuoles (Vac). (A, inset) Magnification of bound vesicle (large arrowhead in A). Size bars represent 100 nm.
Figure 8
Figure 8
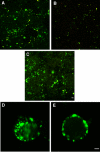
Association of ETEC vesicles with HT29 cells is filipin sensitive and chlorpromazine insensitive. Confocal microscopy of untreated (A), filipin-pretreated (B), or chlorpromazine-pretreated (C) HT29 cells incubated with FITC-ETEC vesicles for 24 h at 37°C. Z-section of a single HT29 cell incubated with FITC-ETEC vesicles without (D) and with (E) filipin. Size bars indicate 20 μm (A–C) and 2 μm (D, E).
Figure 9
Figure 9
ETEC vesicles colocalize with caveolin but not clathrin. Confocal microscopy of HT29 cells incubated with rhodamine-ETEC vesicles (red) for 8 h at 37°C before staining with anti-caveolin (A) or anti-clathrin (B) antibodies detected with FITC-labeled anti-mouse antibody (green). Red vesicles colocalized with green caveolin to give yellow spots (arrowheads) but did not colocalize with clathrin. Size bars indicate 5 μm. (C, D) HT29 cells were incubated with ETEC vesicles for 18 h at 4°C followed by 1 h at 37°C. Vesicles were visualized using anti-E. coli antibody and 10 nm gold-conjugated anti-rabbit antibody. Caveolin was detected with anti-caveolin antibody and 5 nm gold-conjugated anti-mouse antibody (arrowheads). No 5 nm gold label for caveolin was detected near bound 10 nm gold-labeled vesicles prior to the 37°C chase (not shown). Ex, extracellular; C, cytoplasm. Size bars represent 100 nm.

Similar articles

Cited by

References

    1. Anderson RG, Kamen BA, Rothberg KG, Lacey SW (1992) Potocytosis: sequestration and transport of small molecules by caveolae. Science 255: 410–411 - PubMed
    1. Badizadegan K, Dickinson BL, Wheeler HE, Blumberg RS, Holmes RK, Lencer WI (2000) Heterogeneity of detergent-insoluble membranes from human intestine containing caveolin-1 and ganglioside G(M1). Am J Physiol Gastrointest Liver Physiol 278: G895–G904 - PMC - PubMed
    1. Beermann C, Wunderli-Allenspach H, Groscurth P, Filgueira L (2000) Lipoproteins from Borrelia burgdorferi applied in liposomes and presented by dendritic cells induce CD8(+) T-lymphocytes in vitro. Cell Immunol 201: 124–131 - PubMed
    1. Bender FC, Reymond MA, Bron C, Quest AF (2000) Caveolin-1 levels are down-regulated in human colon tumors, and ectopic expression of caveolin-1 in colon carcinoma cell lines reduces cell tumorigenicity. Cancer Res 60: 5870–5878 - PubMed
    1. Beveridge TJ (1999) Structures of gram-negative cell walls and their derived membrane vesicles. J Bacteriol 181: 4725–4733 - PMC - PubMed

Publication types

MeSH terms