Gene expression profiling of microdissected pancreatic ductal carcinomas using high-density DNA microarrays
- PMID: 15548371
- PMCID: PMC1531666
- DOI: 10.1593/neo.04295
Gene expression profiling of microdissected pancreatic ductal carcinomas using high-density DNA microarrays
Abstract
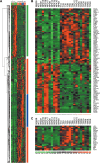
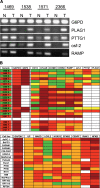
Pancreatic ductal adenocarcinoma (PDAC) remains an important cause of malignancy-related death and is the eighth most common cancer with the lowest overall 5-year relative survival rate. To identify new molecular markers and candidates for new therapeutic regimens, we investigated the gene expression profile of microdissected cells from 11 normal pancreatic ducts, 14 samples of PDAC, and 4 well-characterized pancreatic cancer cell lines using the Affymetrix U133 GeneChip set. RNA was extracted from microdissected samples and cell lines, amplified, and labeled using a repetitive in vitro transcription protocol. Differentially expressed genes were identified using the significance analysis of microarrays program. We found 616 differentially expressed genes. Within these, 140 were also identified in PDAC by others, such as Galectin-1, Galectin-3, and MT-SP2. We validated the differential expression of several genes (e.g., CENPF, MCM2, MCM7, RAMP, IRAK1, and PTTG1) in PDAC by immunohistochemistry and reverse transcription polymerase chain reaction. We present a whole genome expression study of microdissected tissues from PDAC, from microdissected normal ductal pancreatic cells and pancreatic cancer cell lines using high-density microarrays. Within the panel of genes, we identified novel differentially expressed genes, which have not been associated with the pathogenesis of PDAC before.
Figures


Similar articles
-
Gene expression profiles of microdissected pancreatic ductal adenocarcinoma.Virchows Arch. 2003 Oct;443(4):508-17. doi: 10.1007/s00428-003-0884-1. Epub 2003 Aug 27. Virchows Arch. 2003. PMID: 12942322
-
Small Nucleolar Noncoding RNA SNORA23, Up-Regulated in Human Pancreatic Ductal Adenocarcinoma, Regulates Expression of Spectrin Repeat-Containing Nuclear Envelope 2 to Promote Growth and Metastasis of Xenograft Tumors in Mice.Gastroenterology. 2017 Jul;153(1):292-306.e2. doi: 10.1053/j.gastro.2017.03.050. Epub 2017 Apr 5. Gastroenterology. 2017. PMID: 28390868
-
Increased CDC20 expression is associated with pancreatic ductal adenocarcinoma differentiation and progression.J Hematol Oncol. 2012 Apr 4;5:15. doi: 10.1186/1756-8722-5-15. J Hematol Oncol. 2012. PMID: 22475564 Free PMC article.
-
Critical role of laser microdissection for genetic, epigenetic and proteomic analyses in pancreatic cancer.Expert Rev Mol Diagn. 2011 Sep;11(7):695-701. doi: 10.1586/erm.11.62. Expert Rev Mol Diagn. 2011. PMID: 21902531 Review.
-
Microarray-based gene expression profiling in pancreatic ductal carcinoma: status quo and perspectives.Int J Colorectal Dis. 2004 Sep;19(5):401-13. doi: 10.1007/s00384-003-0563-3. Epub 2004 Jan 24. Int J Colorectal Dis. 2004. PMID: 14745573 Review.
Cited by
-
GLI1: A Therapeutic Target for Cancer.Front Oncol. 2021 May 25;11:673154. doi: 10.3389/fonc.2021.673154. eCollection 2021. Front Oncol. 2021. PMID: 34113570 Free PMC article. Review.
-
Diagnostic and prognostic value of cell-cycle regulatory genes in malignant thyroid neoplasms.World J Surg. 2006 May;30(5):767-74. doi: 10.1007/s00268-005-0308-2. World J Surg. 2006. PMID: 16547620
-
Activation of Wnt signalling in stroma from pancreatic cancer identified by gene expression profiling.J Cell Mol Med. 2008 Dec;12(6B):2823-35. doi: 10.1111/j.1582-4934.2008.00289.x. Epub 2008 Feb 24. J Cell Mol Med. 2008. PMID: 18298655 Free PMC article.
-
ZNF281 Promotes Growth and Invasion of Pancreatic Cancer Cells by Activating Wnt/β-Catenin Signaling.Dig Dis Sci. 2017 Aug;62(8):2011-2020. doi: 10.1007/s10620-017-4611-1. Epub 2017 May 18. Dig Dis Sci. 2017. PMID: 28523575
-
The PFA-AMeX method achieves a good balance between the morphology of tissues and the quality of RNA content in DNA microarray analysis with laser-capture microdissection samples.J Toxicol Pathol. 2015 Jan;28(1):43-9. doi: 10.1293/tox.2014-0045. Epub 2014 Dec 19. J Toxicol Pathol. 2015. PMID: 26023261 Free PMC article.
References
-
- Jemal A, Murray T, Samuels A, Ghafoor A, Ward E, Thun MJ. Cancer statistics, 2003. CA Cancer J Clin. 2003;53:5–26. - PubMed
-
- Almoguera C, Shibata D, Forrester K, Martin J, Arnheim N, Perucho M. Most human carcinomas of the exocrine pancreas contain mutant c-K-ras genes. Cell. 1988;53:549–554. - PubMed
-
- Hahn SA, Schutte M, Hoque AT, Moskaluk CA, da Costa LT, Rozenblum E, Weinstein CL, Fischer A, Yeo CJ, Hruban RH, Kern SE. DPC4, a candidate tumor suppressor gene at human chromosome 18q21. Science. 1996;271:350–353. - PubMed
-
- Hruban RH, Offerhaus GJ, Kern SE, Goggins M, Wilentz RE, Yeo CJ. Tumor-suppressor genes in pancreatic cancer. J Hepatobiliary Pancr Surg. 1998;5:383–391. - PubMed
-
- Slebos RJ, Hoppin JA, Tolbert PE, Holly EA, Brock JW, Zhang RH, Bracci PM, Foley J, Stockton P, McGregor LM, Flake GP, Taylor JA. K-ras and p53 in pancreatic cancer: association with medical history, histopathology, and environmental exposures in a population-based study. Cancer Epidemiol Biomark Prev. 2000;9:1223–1232. - PubMed
Publication types
MeSH terms
Substances
LinkOut - more resources
Full Text Sources
Other Literature Sources
Medical
Research Materials
Miscellaneous
