Distinct pathways of insulin-regulated versus diabetes-regulated gene expression: an in vivo analysis in MIRKO mice
- PMID: 15546994
- PMCID: PMC534529
- DOI: 10.1073/pnas.0407574101
Distinct pathways of insulin-regulated versus diabetes-regulated gene expression: an in vivo analysis in MIRKO mice
Abstract
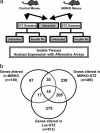
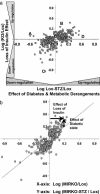
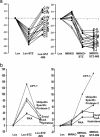
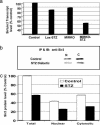
Diabetes mellitus is a complex metabolic disorder accompanied by alterations in cellular physiology, metabolism, and gene expression. These alterations can be primary (due to loss of direct insulin action) or secondary (due to the metabolic perturbations associated with the disease). To dissect and quantitate these two separate effects, we compared the skeletal muscle gene-expression profiles of muscle insulin receptor knockout (MIRKO) mice and their Lox controls in the basal, streptozotocin-induced diabetic, and insulin-treated diabetic states. Pure deficiency of insulin action as present in the MIRKO mouse results in regulation of 130 genes, with down-regulation of NSF (N-ethylmaleimide-sensitive fusion protein) and VAMP-2 (vesicle-associated membrane protein 2), stearoyl CoA desaturase 1, and cAMP-specific phosphodiesterase 4B, as well as up-regulation of some signaling-related genes, such as Akt2, and the fatty-acid transporter CD36. In diabetes, additional transcriptional mechanisms are activated, resulting in alterations in expression of approximately 500 genes, including a highly coordinated down-regulation of genes of the mitochondrial electron-transport chain and one of the mammalian homologues of the histone deacetylase Sir2, which has been implicated in the link between nutrition and longevity. These distinct pathways of direct and indirect regulation of gene expression provide insights into the complex mechanisms of transcriptional control in diabetes and areas of potential therapeutic targeting.
Figures


Similar articles
-
The soybean peptide aglycin regulates glucose homeostasis in type 2 diabetic mice via IR/IRS1 pathway.J Nutr Biochem. 2012 Nov;23(11):1449-57. doi: 10.1016/j.jnutbio.2011.09.007. Epub 2012 Jan 25. J Nutr Biochem. 2012. PMID: 22278080
-
Coordinated patterns of gene expression for substrate and energy metabolism in skeletal muscle of diabetic mice.Proc Natl Acad Sci U S A. 2002 Aug 6;99(16):10587-92. doi: 10.1073/pnas.142301999. Epub 2002 Jul 29. Proc Natl Acad Sci U S A. 2002. PMID: 12149437 Free PMC article.
-
Cellular and molecular mechanisms of adipose tissue plasticity in muscle insulin receptor knockout mice.Endocrinology. 2004 Apr;145(4):1926-32. doi: 10.1210/en.2003-0882. Epub 2003 Dec 18. Endocrinology. 2004. PMID: 14684612
-
Metabolism and insulin signaling in common metabolic disorders and inherited insulin resistance.Dan Med J. 2014 Jul;61(7):B4890. Dan Med J. 2014. PMID: 25123125 Review.
-
Intracellular mechanisms underlying increases in glucose uptake in response to insulin or exercise in skeletal muscle.Acta Physiol Scand. 2001 Mar;171(3):249-57. doi: 10.1046/j.1365-201x.2001.00827.x. Acta Physiol Scand. 2001. PMID: 11412137 Review.
Cited by
-
Mammalian Sir2 homolog SIRT3 regulates global mitochondrial lysine acetylation.Mol Cell Biol. 2007 Dec;27(24):8807-14. doi: 10.1128/MCB.01636-07. Epub 2007 Oct 8. Mol Cell Biol. 2007. PMID: 17923681 Free PMC article.
-
Munc18c depletion selectively impairs the sustained phase of insulin release.Diabetes. 2009 May;58(5):1165-74. doi: 10.2337/db08-1059. Epub 2009 Feb 2. Diabetes. 2009. PMID: 19188424 Free PMC article.
-
Accelerated postnatal growth increases lipogenic gene expression and adipocyte size in low-birth weight mice.Diabetes. 2009 May;58(5):1192-200. doi: 10.2337/db08-1266. Epub 2009 Feb 10. Diabetes. 2009. PMID: 19208909 Free PMC article.
-
Defects in muscle branched-chain amino acid oxidation contribute to impaired lipid metabolism.Mol Metab. 2016 Aug 6;5(10):926-936. doi: 10.1016/j.molmet.2016.08.001. eCollection 2016 Oct. Mol Metab. 2016. PMID: 27689005 Free PMC article.
-
The role of mitochondria in the pathophysiology of skeletal muscle insulin resistance.Endocr Rev. 2010 Feb;31(1):25-51. doi: 10.1210/er.2009-0003. Epub 2009 Oct 27. Endocr Rev. 2010. PMID: 19861693 Free PMC article. Review.
References
-
- Skyler, J. S. & Oddo, C. (2002) Diabetes Metab Res. Rev. 18 Suppl 3, S21–S26. - PubMed
-
- Kahn, C. R. (1994) Diabetes 43, 1066–1084. - PubMed
-
- Sreekumar, R., Halvatsiotis, P., Schimke, J. C. & Nair, K. S. (2002) Diabetes 51, 1913–1920. - PubMed
-
- O'Brien, R. M. & Granner, D. K. (1996) Physiol. Rev. 76, 1109–1161. - PubMed
Publication types
MeSH terms
Substances
Grants and funding
LinkOut - more resources
Full Text Sources
Medical
Molecular Biology Databases
Miscellaneous

