Comparative Study
. 2004 Nov 15;200(10):1299-314.
doi: 10.1084/jem.20041049.

Insufficient production and tissue delivery of CD4+ memory T cells in rapidly progressive simian immunodeficiency virus infection

Affiliations
Comparative Study

Insufficient production and tissue delivery of CD4+ memory T cells in rapidly progressive simian immunodeficiency virus infection

Louis J Picker et al. J Exp Med. .

Abstract

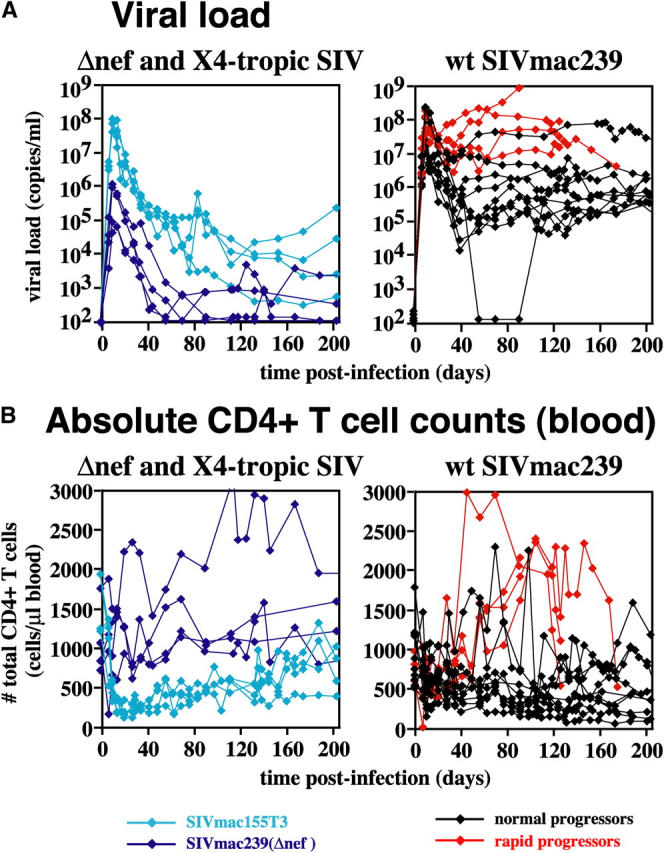
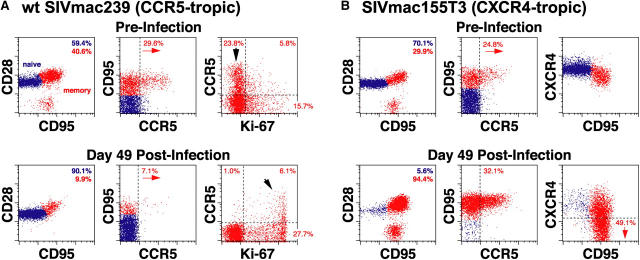
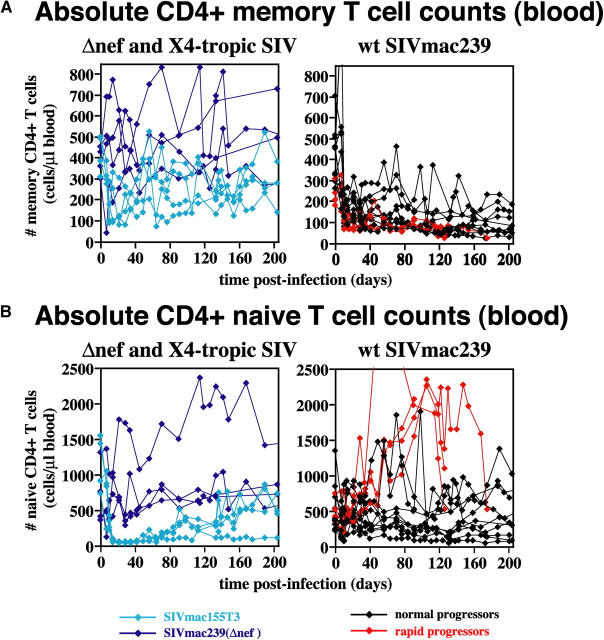
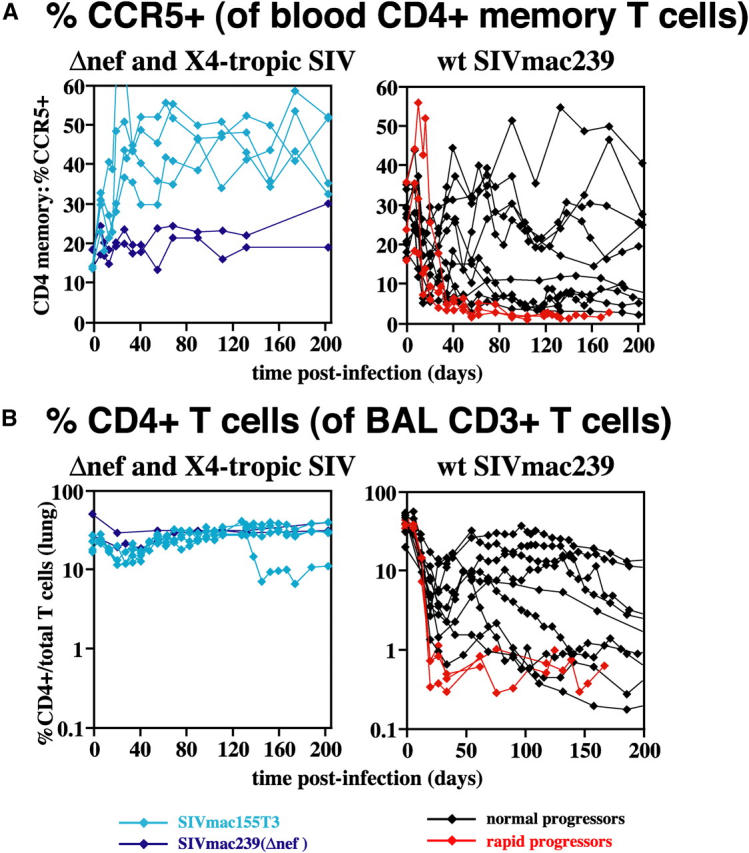
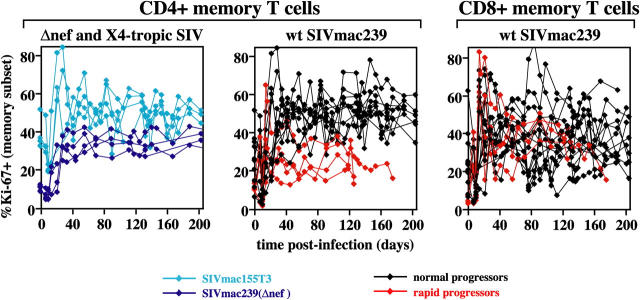
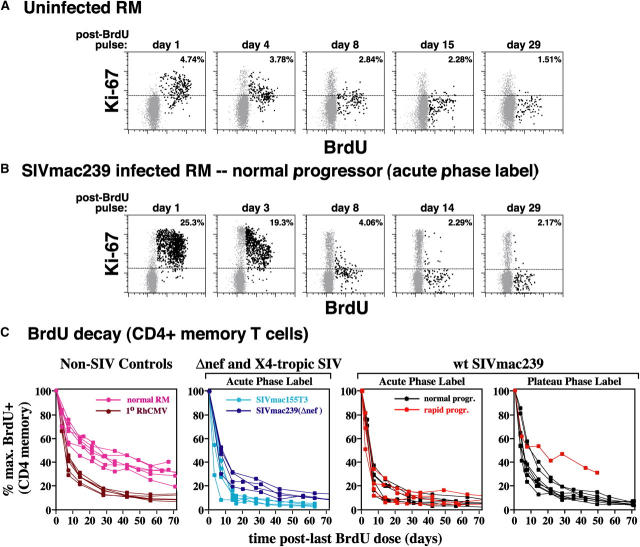
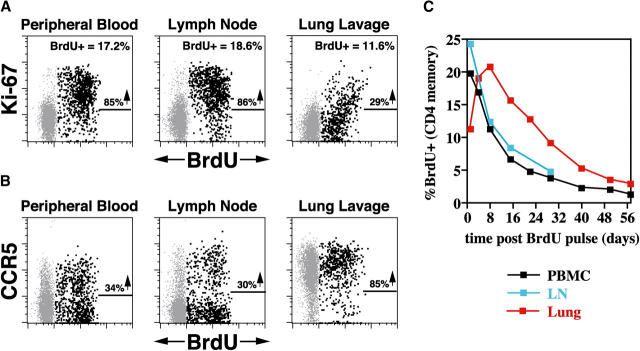
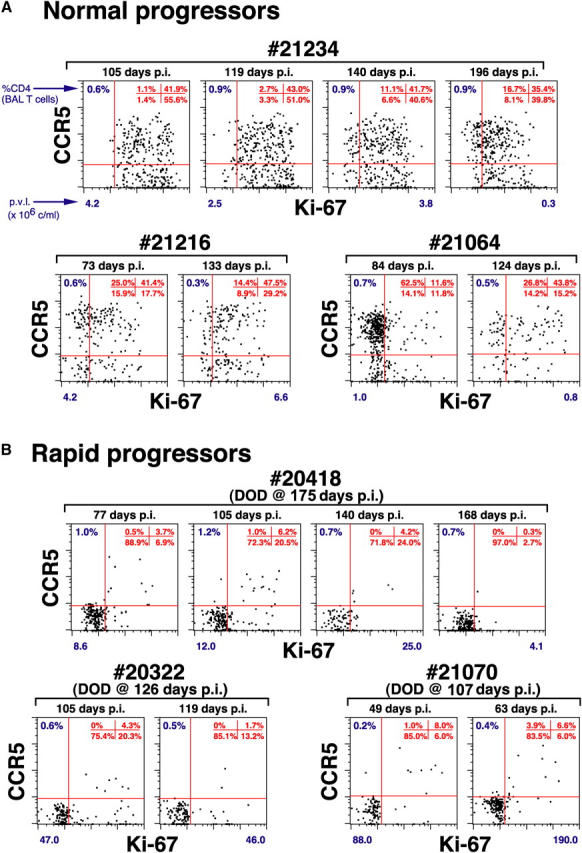
The mechanisms linking human immunodeficiency virus replication to the progressive immunodeficiency of acquired immune deficiency syndrome are controversial, particularly the relative contribution of CD4+ T cell destruction. Here, we used the simian immunodeficiency virus (SIV) model to investigate the relationship between systemic CD4+ T cell dynamics and rapid disease progression. Of 18 rhesus macaques (RMs) infected with CCR5-tropic SIVmac239 (n=14) or CXCR4-tropic SIVmac155T3 (n=4), 4 of the former group manifested end-stage SIV disease by 200 d after infection. In SIVmac155T3 infections, naive CD4+ T cells were dramatically depleted, but this population was spared by SIVmac239, even in rapid progressors. In contrast, all SIVmac239-infected RMs demonstrated substantial systemic depletion of CD4+ memory T cells by day 28 after infection. Surprisingly, the extent of CD4+ memory T cell depletion was not, by itself, a strong predictor of rapid progression. However, in all RMs destined for stable infection, this depletion was countered by a striking increase in production of short-lived CD4+ memory T cells, many of which rapidly migrated to tissue. In all rapid progressors (P <0.0001), production of these cells initiated but failed by day 42 of infection, and tissue delivery of new CD4+ memory T cells ceased. Thus, although profound depletion of tissue CD4+ memory T cells appeared to be a prerequisite for early pathogenesis, it was the inability to respond to this depletion with sustained production of tissue-homing CD4+ memory T cells that best distinguished rapid progressors, suggesting that mechanisms of the CD4+ memory T cell generation play a crucial role in maintaining immune homeostasis in stable SIV infection.


Figures

Figure 1.
Figure 1.
Plasma viral loads (A) and absolute peripheral blood CD4+ T cell counts (B) in CCR5-tropic, CXCR4-tropic, and attenuated SIV infections. Data from all 22 SIV-infected RMs included in this work are shown: 4 each with SIVmac239(Δnef) (dark blue traces) and SIVmac155T3 (light blue), and 14 with WT SIVmac239, of which 4 were rapid (red) and 10 (black) were normal progressors. Both acute and plateau phase viral loads were significantly higher in the rapid progressor RMs than in their clinically stable SIVmac239-infected counterparts. P = 0.004 and 0.001 (t test), and P = 0.02 and 0.01 (Wilcoxin rank sum) for on or before, or after, day 42 after infection, respectively. The absolute CD4 counts of these two groups were significantly different after day 42 after infection (P = 0.001 and 0.01 for t and Wilcoxin rank sum tests, respectively), but paradoxically, although the normal progressors showed the expected slow decline in CD4 counts, rapid progressors showed a pronounced CD4+ T lymphocytosis.
Figure 2.
Figure 2.
CD4+ T cell depletion patterns in CCR5- (A) versus CXCR4-tropic (B) SIV infection. (A) PBMCs from a typical WT SIVmac239-infected normal progressor were examined for their correlated expression of cell surface CD4 versus CCR5 versus CD28 versus CD95 or CD4 versus CCR5 versus Ki-67 versus CD95, both before and 49 d after infection (viral load = 7.4 × 10⁶ copies/ml and absolute blood CD4 counts = 500 cells/μl at day 49 after infection). 5,000 events, gated on total CD4+ T cells (left and middle) or CD4+ (CD95high) memory T cells (right) are shown. Overall, naive (blue) and memory (red) T cell frequencies are shown in the upper right corner of the left panels. The percent CCR5+ within the memory subset is shown in the middle panels, and the memory subsets defined by CCR5 versus Ki-67 are shown in the right panels. Note the striking relative depletion of CD4+ memory T cells, and within the memory population, the CCR5-expressing subset, with this subset going from predominantly Ki-67 preinfection to predominantly Ki-67bright+ postinfection (arrows). (B) PBMCs from a representative SIVmac155T3-infected RM were examined for their correlated expression of cell surface CD4 versus CCR5 versus CD28 versus CD95 or CD4 versus CXCR4 versus CD28 versus CD95, both before and 49 d after infection (viral load = 1.2 × 10⁵ copies/ml and absolute blood CD4 count = 440 cells/μl at day 49 after infection). 5,000 events, gated on total CD4+ T cells are shown with events within the naive and memory cell clusters colored blue and red, respectively. Note the profound loss of naive CD4+ T cells, increased frequencies of CCR5+ cells among CD4+ memory T cells, and loss of CD4+ T cell CXCR4 staining intensity, particularly within the memory subset.
Figure 3.
Figure 3.
Absolute peripheral blood CD4+ memory (A) and naive (B) T cell counts in CCR5-tropic, CXCR4-tropic, and attenuated SIV infections. Absolute memory (A) and naive (B) CD4+ T cell counts were determined using absolute total CD4 counts (see Fig. 1) and naive/memory fractions based on CD28 versus CD95 staining criteria (reference 25). Data for all 22 SIV-infected RMs are shown. Rapid progressors did not differ from normal progressors in regard to memory CD4+ T cell numbers (P = 0.11 and 0.18 for days 0–200 after infection by t and Wilcoxin rank sum tests, respectively). In contrast, with the onset of the plateau phase of infection, rapid progressors manifested a pronounced CD4+ naive T cell lymphocytosis, whereas naive CD4+ T cell numbers in normal progressors were largely stable (P < 0.0001 and P = 0.006 for after day 42 after infection by t and Wilcoxin rank sum tests, respectively).
Figure 4.
Figure 4.
Depletion patterns of CCR5+ CD4+ memory T cell “targets” in blood (A) and tissue (B) in CCR5-tropic, CXCR4-tropic, and attenuated SIV infections. (A) The percent of cells expressing CCR5 within the peripheral blood CD4+ memory subset was determined as shown in Fig. 2. Data on this parameter were not available for one WT SIVmac239-infected, rapid progressor and two SIVmac239(Δnef)-infected RMs; all other study RMs are included in the figure. The difference in CCR5+ CD4+ memory T cell frequencies between rapid and normal progressors was significant in plateau phase. P = 0.004 and 0.01 for after day 42 after infection by t and Wilcoxin rank sum tests, respectively. (B) The percentage of CD4+ cells within the total population of CD3+ BAL T cells is shown for 18 of the 22 SIV-infected RMs. In the four RMs not shown, BAL data was not obtained until day 77 after infection or later. The two of these RMs infected with SIVmac239(Δnef) demonstrated normal CD4+ T cell representation in BALs (33–39%) at these later time points (consistent with no depletion). In contrast, the two of these RMs infected with WT SIVmac239, one a rapid progressor and one a normal progressor, both demonstrated CD4+ T cell frequencies in BALs of <1% after day 77 after infection (consistent with profound depletion). Statistical comparison of the degree of depletion in SIVmac239-infected rapid versus normal progressors was equivocal. In acute infection (before day 42 after infection), the difference in CD4+ T cell percentages between WT SIVmac239-infected rapid and normal progressors was significant at P = 0.02 by the Wilcoxin rank sum test, but not by the t test. After day 42 after infection, the reverse was true: the t test demonstrated a p-value of 0.008, whereas the Wilcoxin rank sum test was not significant.
Figure 5.
Figure 5.
CD4+ and CD8+ memory T cell proliferation in CCR5-tropic, CXCR4-tropic, and attenuated SIV infections. PBMCs were examined for their correlated expression of Ki-67 versus CD28 versus CD95 versus either CD4 or CD8β, and the percent Ki-67+ was determined for the memory T cell subset of each lineage. The figure includes CD4+ lineage data from all 22 SIV-infected RMs, and CD8 lineage data for all 14 RMs infected with WT SIVmac239. The plateau phase differences in CD4+ memory T cell proliferation (e.g., percent Ki-67+) between the SIVmac239-infected normal and rapid progressors was highly significant with P < 0.0001 and P = 0.006 for after day 42 after infection by t and Wilcoxin rank sum tests, respectively. In contrast, CD8+ memory T cell proliferation during the same time period did not significantly differ between these two groups.
Figure 6.
Figure 6.
BrdU decay kinetics in circulating CD4+ memory T cells in normal RMs, primary RhCMV infections, and CCR5-tropic, CXCR4-tropic, and attenuated SIV infections. SIV-infected and control RMs (either uninfected or 1° RhCMV infected) were administered 30 mg/kg BrdU IV for 4 consecutive days, with the first sampling occurring 24 h after the last BrdU dose. In the SIV infections, acute phase labeling was performed either on days 10–13 after infection or days 24–27 after infection. Plateau phase labeling was performed after day 99 after infection. In the 1° RhCMV infections, labeling was performed on days 10–13 after infection. (A and B) The correlated expression of BrdU versus Ki-67 on CD4+ CD95high (memory) T cells from representative healthy, uninfected (A) and WT SIVmac239-infected normal progressor (B) RMs are shown (each profile with 5,000 gated events). The percentages in the upper right corners of the profiles represent the total BrdU+ fraction of the gated CD4+ memory cells. The dotted horizontal lines delineate the upper extent of the negative population in the Ki-67 channel and serve as a reference for evaluating the progressive loss of Ki-67 expression by BrdU+ cells. (C) PBMCs were stained for BrdU versus CD28 versus CD95 versus CD4 at the designated time points, and percent BrdU+ was determined for the CD4+ memory subset. The decay kinetics of BrdU+ (CD4+ memory) cells in all acutely infected cohorts were significantly different from uninfected animals (P < 0.0001 by t test for normal vs. 1° RhCMV-, WT SIVmac239-, SIVmac155T3-, or SIVmac239(Δnef)-infected RMs), but these kinetics did not significantly differ between WT SIVmac239-infected rapid versus normal progressors (P = 0.84 by t test), or between either of these cohorts and RMs infected with SIVmac155T3 (P = 0.15 and 0.06, respectively).
Figure 7.
Figure 7.
BrdU labeling and decay kinetics in the blood versus lymph node versus lung in a plateau phase WT SIVmac239-infected normal progressor. (A and B) 1 d after BrdU administration on days 99–102 after infection, PBMCs, lymph node cells, and BALs from a clinically stable WT SIV mac239-infected RM were examined for correlated expression of CD4, BrdU, and either Ki-67 (A) or CCR5 (B), with CD95 also used in PBMC and lymph node analyses to delineate the CD4+ memory subset. 5,000 events are shown, gated on CD4+ CD95high memory T cells in PBMC and lymph node preparations, and on total CD4+ T cells (which are all memory) in BALs. In A, the percentages of BrdU+ cells within these gated populations are shown in the upper right hand corner of each profile, with the percentages adjacent to the arrows indicating the fraction of these BrdU+ cells that are also Ki-67+. In B, the percentages adjacent to the arrows indicate the fraction of BrdU+ cells that are also CCR5+. (C) The percent of CD4+ memory T cells demonstrating BrdU reactivity are plotted for each site over the time course shown. The results shown are representative of three plateau phase SIVmac239-infected normal progressors and four SIVmac155T3-infected RMs.
Figure 8.
Figure 8.
Pulmonary CD4+ T cell phenotype in WT SIVmac239-infected rapid versus normal progressors. BAL preparations were examined for correlated expression of CD4, CD8β, Ki-67, and CCR5 at different plateau phase time points in all 14 WT SIVmac239-infected RMs. The profiles are gated on CD4+ T cells with all available events shown (>200). The percent of CD4+ T cells (of total T cells) in each BAL specimen is indicated in the upper left of each profile. The quadrant statistics for CCR5 versus Ki-67 expression are provided in the upper right of each profile. The plasma viral loads (p.v.l. × 106 copies/ml) for each time point represented are shown beneath each profile. The profiles of WT SIVmac239-infected normal progressors are representative of the patterns observed during plateau phase in all 10 RMs in this cohort with the salient, common feature being that the majority of lung CD4+ T cells in these RMs expressed either CCR5, Ki-67, or both. In contrast, in all rapid progressors, >80% of residual CD4+ T cells in the BALs of rapid progressors lacked both CCR5 and Ki-67 expression (see Results).

Similar articles

Cited by

References

    1. Levy, J.A. 1993. Pathogenesis of human immunodeficiency virus infection. Microbiol. Rev. 57:183–289. - PMC - PubMed
    1. Cohen, O.J., and A.S. Fauci. 2001. Pathogenesis and medical aspests of HIV-1 infection. Fields Virology. D.M. Knipe and P.M. Howley, editors. Lippincott Williams & Wilkins, Philadelphia. 2043–2094.
    1. McCune, J.M. 2001. The dynamics of CD4+ T-cell depletion in HIV disease. Nature. 410:974–979. - PubMed
    1. Douek, D.C., L.J. Picker, and R.A. Koup. 2003. T cell dynamics in HIV-1 infection. Annu. Rev. Immunol. 21:265–304. - PubMed
    1. Hazenberg, M.D., D. Hamann, H. Schuitemaker, and F. Miedema. 2000. T cell depletion in HIV-1 infection: how CD4+ T cells go out of stock. Nat. Immunol. 1:285–289. - PubMed

Publication types

MeSH terms

Substances