Role of CCR8 and other chemokine pathways in the migration of monocyte-derived dendritic cells to lymph nodes
- PMID: 15534368
- PMCID: PMC2211916
- DOI: 10.1084/jem.20032152
Role of CCR8 and other chemokine pathways in the migration of monocyte-derived dendritic cells to lymph nodes
Abstract
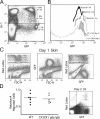
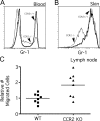
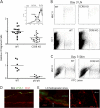
Studying the influence of chemokine receptors (CCRs) on monocyte fate may reveal information about which subpopulations of monocytes convert to dendritic cells (DCs) and the migration pathways that they use. First, we examined whether prominent CCRs on different monocyte subsets, CCR2 or CX3CR1, mediated migration events upstream of the accumulation of monocyte-derived DCs in lymph nodes (LNs). Monocytes were labeled and traced by uptake of latex microspheres in skin. Unexpectedly, neither CCR2 nor CX3CR1 were required. However, absence of CCR2 led to an increased labeling of the minor Gr-1int monocyte population, and the number of latex+ DCs that emigrated to LNs was correspondingly increased. Characterization of Gr-1int monocytes revealed that they selectively expressed CCR7 and CCR8 mRNA in blood. CCR7 and CCR8 pathways were used by monocyte-derived DCs during mobilization from skin to LNs. The role of CCR8 in emigration from tissues also applied to human monocyte-derived cells in a model of transendothelial trafficking. Collectively, the data suggest that Gr-1int monocytes may be most disposed to become a lymphatic-migrating DCs. When these monocyte-derived DCs exit skin to emigrate to LNs, they use not only CCR7 but also CCR8, which was not previously recognized to participate in migration to LNs.
Figures


Similar articles
-
Cutting edge: secondary lymphoid-tissue chemokine (SLC) and CC chemokine receptor 7 (CCR7) participate in the emigration pathway of mature dendritic cells from the skin to regional lymph nodes.J Immunol. 1999 Mar 1;162(5):2472-5. J Immunol. 1999. PMID: 10072485
-
Differential expression of CCL19 by DC-Lamp+ mature dendritic cells in human lymph node versus chronically inflamed skin.J Pathol. 2003 Jan;199(1):98-106. doi: 10.1002/path.1255. J Pathol. 2003. PMID: 12474232
-
CC chemokine receptor-7 on dendritic cells is induced after interaction with apoptotic tumor cells: critical role in migration from the tumor site to draining lymph nodes.Cancer Res. 2000 Apr 15;60(8):2209-17. Cancer Res. 2000. PMID: 10786686
-
Migratory fate and differentiation of blood monocyte subsets.Immunobiology. 2006;211(6-8):609-18. doi: 10.1016/j.imbio.2006.05.025. Epub 2006 Jul 10. Immunobiology. 2006. PMID: 16920499 Review.
-
Dendritic cell migration to lymph nodes: cytokines, chemokines, and lipid mediators.Semin Immunol. 2001 Oct;13(5):267-74. doi: 10.1006/smim.2001.0322. Semin Immunol. 2001. PMID: 11502161 Review.
Cited by
-
Lymphatic system: an active pathway for immune protection.Semin Cell Dev Biol. 2015 Feb;38:83-9. doi: 10.1016/j.semcdb.2014.11.012. Epub 2014 Dec 19. Semin Cell Dev Biol. 2015. PMID: 25534659 Free PMC article. Review.
-
In Sickness and in Health: The Immunological Roles of the Lymphatic System.Int J Mol Sci. 2021 Apr 24;22(9):4458. doi: 10.3390/ijms22094458. Int J Mol Sci. 2021. PMID: 33923289 Free PMC article. Review.
-
Structure and Immune Function of Afferent Lymphatics and Their Mechanistic Contribution to Dendritic Cell and T Cell Trafficking.Cells. 2021 May 20;10(5):1269. doi: 10.3390/cells10051269. Cells. 2021. PMID: 34065513 Free PMC article. Review.
-
Antigen archiving by lymph node stroma: A novel function for the lymphatic endothelium.Eur J Immunol. 2015 Oct;45(10):2721-9. doi: 10.1002/eji.201545739. Epub 2015 Sep 10. Eur J Immunol. 2015. PMID: 26278423 Free PMC article. Review.
-
Comparison of gene expression profiles between human and mouse monocyte subsets.Blood. 2010 Jan 21;115(3):e10-9. doi: 10.1182/blood-2009-07-235028. Epub 2009 Nov 12. Blood. 2010. PMID: 19965649 Free PMC article.
References
-
- Randolph, G.J., K. Inaba, D.F. Robbiani, R.M. Steinman, and W.A. Muller. 1999. Differentiation of phagocytic monocytes into lymph node dendritic cells in vivo. Immunity. 11:753–761. - PubMed
-
- Passlick, B., D. Flieger, and H.W. Ziegler-Heitbrock. 1989. Identification and characterization of a novel monocyte subpopulation in human peripheral blood. Blood. 74:2527–2534. - PubMed
-
- Geissmann, F., S. Jung, and D.R. Littman. 2003. Blood monocytes consist of two principal subsets with distinct migratory properties. Immunity. 19:71–82. - PubMed
-
- Sunderkotter, C., T. Nikolic, M.J. Dillon, N. Van Rooijen, M. Stehling, D.A. Drevets, and P.J. Leenen. 2004. Subpopulations of mouse blood monocytes differ in maturation stage and inflammatory response. J. Immunol. 172:4410–4417. - PubMed
Publication types
MeSH terms
Substances
LinkOut - more resources
Full Text Sources
Other Literature Sources
Molecular Biology Databases

