. 2004 Nov 3;24(44):9847-61.
doi: 10.1523/JNEUROSCI.0738-04.2004.

The kinetic profile of intracellular calcium predicts long-term potentiation and long-term depression

Affiliations

The kinetic profile of intracellular calcium predicts long-term potentiation and long-term depression

Iskander Ismailov et al. J Neurosci. .

Abstract

Efficiency of synaptic transmission within the neocortex is regulated throughout life by experience and activity. Periods of correlated or uncorrelated presynaptic and postsynaptic activity lead to enduring changes in synaptic efficiency [long-term potentiation (LTP) and long-term depression (LTD), respectively]. The initial plasticity triggering event is thought to be a precipitous rise in postsynaptic intracellular calcium, with higher levels inducing LTP and more moderate levels inducing LTD. We used a pairing protocol in visual cortical brain slices from young guinea pigs with whole-cell recording and calcium imaging to compare the kinetic profiles of calcium signals generated in response to individual pairings along with the cumulative calcium wave and plasticity outcome. The identical pairing protocol applied to layer 2/3 pyramidal neurons results in different plasticity outcomes between cells. These differences are not attributable to variations in the conditioning protocol, cellular properties, inter-animal variability, animal age, differences in spike timing between the synaptic response and spikes, washout of plasticity factors, recruitment of inhibition, or activation of different afferents. The different plasticity outcomes are reliably predicted by individual intracellular calcium transients in the dendrites after the first few pairings. In addition to the differences in the individual calcium transients, the cumulative calcium wave that spreads to the soma also has a different profile for cells that undergo LTP versus LTD. We conclude that there are biological differences between like-type cells in the dendritic calcium signals generated by coincident synaptic input and spiking that determine the sign of the plasticity response after brief associations.


Figures
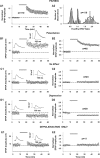
Figure 1.
Figure 1.
Effect of pairing on synaptic strength in whole-cell configuration with fura-4F in the pipette solution. In all panels in which grouped data are illustrated (A1, B2, C2, D2, E2), every other data point is illustrated for graphical clarity. Dashed horizontal lines indicate average baseline peak amplitude responses normalized to 1.0 for all grouped results (A1, B2, C2, D2, E2) or average raw baseline peak amplitude responses for individual example records (B1, C1, D1, E1). The shaded line above records indicates time of application of 10 min pairing protocol (A1, B1, B2, C1, C2, D1, D2) or time of application of depolarizing pulses alone (E1, E2). A1, Summary time plot of EPSP changes in response to pairing. Synaptic responses to the constant-current square-wave pulses (50-100 μA in amplitude and 50 μsec in duration) delivered at 0.1 Hz to a bipolar electrode positioned in layer VI on a beam with the recording electrode were acquired in a whole-cell current-clamp mode (I = 0). Standard pipette solution contained (in mm): 110 K-gluconate, 10 KCl, 10 HEPES, 10 Na2-phosphocreatine, 2 Mg1.3-ATP, 0.2 Na3-GTP, 0.1, pH 7.2, osmolarity = 290 mOsm, and was supplemented with 100 μm fura-4F. Synaptic plasticity was induced by a single train of 60 pairings of afferent stimulation coincident with intracellular depolarization of the postsynaptic cell to approximately -10 mV. Symbols and error bars represent means ± SEM (n = 110) of the EPSP amplitudes (measured as a difference between baseline and peak) normalized for the average amplitude of 30 consecutive evoked synaptic responses collected during the last 5 min of recording before pairing. A2, Distribution of normalized EPSP amplitude changes in response to pairing. Bars in the graph represent binned changes in synaptic efficacy in all 110 cells, measured as a ratio of the average EPSP amplitude of 30 consecutive responses to afferent stimulation collected between 25th and 30th min after pairing to the average amplitude of 30 consecutive EPSPs during the last 5 min of recording before pairing. Bin width is equal to 0.05. Line in the graph represents a trimodal Gaussian fit of the data with the following values: peaks (M ± m) 0.57 ± 0.08 (N1max = 9.5); 1.01 ± 0.03 (N2max = 9.5); 1.86 ± 0.22 (N3max = 4.5); R2 = 0.79; DOF-R2 = 0.75; SEE = 1.28. B1, C1, D1, Recordings of the EPSP peak amplitude before and after pairing in three individual cells, each exhibiting potentiation, no change in synaptic strength, and depression, respectively. Shown in the insets next to the control and postpairing parts of the time plots are the average EPSP traces from 30 consecutive responses collected during the last 5 min before pairing and between the 25th and 30th min of recording after pairing in the same cells, respectively. B2, C2, D2, Time plot of normalized changes in EPSP peak amplitude in response to pairing in the groups of cells exhibiting potentiation (n = 48), no change in synaptic strength (n = 23), and depression (n = 39), respectively, from the sample of 110 cells shown in A1 and A2. Symbols and error bars represent means ± SEM of the EPSP amplitudes measured as a difference between baseline and peak and normalized for the average EPSP amplitude of 30 consecutive responses collected during the last 5 min of recording before pairing for the respective numbers of observations. E1, E2, Recordings of the EPSP peak amplitude in an individual neuron and in a sample of 11 cells subjected to a 0.1 Hz train of 60 intracellular depolarizations to approximately -10 mV (without afferent stimulation), respectively. Shown in the insets in E1 are the average EPSP traces from 30 consecutive responses collected during the last 5 min of control recording and between 25th and 30th min of recording after the experimental paradigm.
Figure 3.
Figure 3.
Effect of pairing on synaptic strength in response to layer 6 stimulation in the conventional whole-cell configuration (without fura-4F in the pipette solution) (panels in A) and in the perforated-patch configuration (also without fura-4F in the pipette solution) (panels in B). For the conventional whole-cell recordings, standard pipette solution was used except that fura-4F was omitted (see Fig. 1 legend). For perforated-patch experiments, the pipettes were first tip-filled with the standard pipette solution and then backfilled with the same solution supplemented with 200 μg/ml amphotericin B. The afferent stimulation in layer 6 and the pairing protocol were the same as described in Fig. 1. In all panels in which grouped data are illustrated (A1, A3-A5, B1, B3-B5), every other data point is illustrated for graphical clarity. Dashed horizontal line indicates average baseline peak amplitude responses normalized to 1.0 for all grouped results. Shaded line above records indicates time of application of 10 min pairing protocol. A1 (n = 39)-B1 (n = 21), Summary time plots of EPSP changes in response to pairing for entire samples tested with these protocols. Here and elsewhere in the figure, symbols and error bars represent means ± SEM of the EPSP amplitudes measured as the difference between baseline and peak and normalized for the average EPSP amplitude of 30 consecutive responses collected during the last 5 min of recording before pairing, for the respective number of experiments.A2-B2, Distributions of normalized EPSP amplitude changes in response to pairing in all 39 cells studied in the conventional whole-cell configuration (without fura-4F) and in all 21 cells studied in the perforated-patch configuration (also without fura-4F). Bars in the graph represent binned (bin width 0.05) changes in synaptic efficacy measured as a ratio of the postpairing response (average EPSP amplitude of 30 consecutive responses to afferent stimulation collected between the 25th and 30th min after pairing) to the prepairing response (average amplitude of 30 consecutive EPSPs during the last 5 min of recording before pairing). Line in the graphs represents a trimodal Gaussian fit of the data. For the conventional whole-cell data distribution, parameters of the fit were as follows: peaks (M ± m) 0.64 ± 0.10 (N1max = 2.91); 0.99 ± 0.04 (N2max = 4.02); 1.92 ± 0.12 (N3max = 2.82); R2 = 0.78; DOF-R2 = 0.74; SEE = 0.61. For the perforated-patch histogram, parameters of the fit were as follows: peaks (M ± m) 0.57 ± 0.51 (N1max = 4.02); 1.03 ± 0.05 (N2max = 1.99); 1.92 ± 0.06 (N3max = 2.69); R2 = 0.83; DOF-R2 = 0.80; SEE = 0.45. A3-B3, Summary time plots of EPSP changes in response to pairing for the subsample of cells that underwent LTP only for the whole-cell (n = 17) and perforated-patch (n = 9) experiments (without fura-4F). A4-B4, Summary time plots of EPSP changes in response to pairing for the subsample of cells that did not change in response to the pairing protocol for the whole-cell (n = 8) and perforated-patch (n = 4) experiments. A5-B5, Summary time plots of EPSP changes in response to pairing for the subsample of cells that underwent LTD only for the whole-cell (n = 14) and perforated-patch (n = 8) experiments.
Figure 5.
Figure 5.
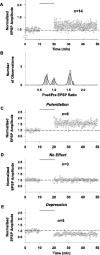
Effect of pairing on synaptic strength in response to stimulation in layer 4 on beam with the recorded cell (recordings done in the conventional whole-cell configuration without fura-4F in the pipette solution and with bicuculline omitted from the bathing solution). In all panels with grouped data (A, C-E), every other data point is illustrated for graphical clarity. Dashed horizontal lines indicate average baseline peak amplitude responses normalized to 1.0 for all grouped results. Shaded line above records indicates time of application of 10 min pairing protocol. A, Summary time plot of EPSP changes in response to pairing for entire group of 14 cells tested with this protocol. Symbols and error bars represent means ± SEM of the EPSP amplitudes measured as the difference between baseline and peak and normalized for the average EPSP amplitude of 30 consecutive responses collected during the last 5 min of recording before pairing. B, Distribution of normalized EPSP amplitude changes plotted as postpairing/prepairing ratios in response to pairing for 14 cells in response to layer 4 stimulation. Bars in the graph represent binned (bin width 0.05) changes in synaptic efficacy measured as a ratio of the average EPSP amplitude of 30 consecutive responses to afferent stimulation collected between the 25th and 30th min after pairing to the average amplitude of 30 consecutive EPSPs during the last 5 min of recording before pairing. Line in the graphs represents a trimodal Gaussian fit of the data. The parameters of the fit were as follows: peaks (M ± m) 0.73 ± 0.05 (N1max = 2.5); 0.99 ± 0.05 (N2max = 1.52); 1.53 ± 0.05 (N3max = 3.08); R2 = 0.80; DOF-R2 = 0.76; SEE = 0.41. C-E, Time plot of normalized changes in EPSP peak amplitude in response to pairing in the groups of cells exhibiting potentiation (C; n=6), no change in synaptic strength (D; n = 3), and depression (E; n = 5), respectively, from the sample of 14 cells shown in A and B. Symbols and error bars represent means ± SEM of the EPSP amplitudes measured as a difference between baseline and peak and normalized for the average EPSP amplitude of 30 consecutive responses collected during the last 5 min of recording before pairing for the respective numbers of observations.
Figure 2.
Figure 2.
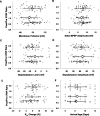
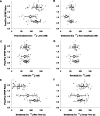
Synaptic plasticity outcome as a function of the resting membrane potential (A), the initial EPSP amplitude (B), the level of postsynaptic depolarization (C), the magnitude of postsynaptic depolarization (D), the change in input resistance (Rin) (E), and the age of the animal from which the slices were obtained (F). Crosshair symbols represent the ratio of average EPSP postpairing to prepairing amplitude responses (ordinate) and the value of the indicated parameter (abscissa) for each cell (n = 110) subjected to pairing. The mean ± SD values for the relative change in the EPSP peak amplitudes for the three plasticity outcome groups plotted along the ordinate are 1.89 ± 0.21 for the LTP group, 1.06 ± 0.09 for the no change group, and 0.61 ± 0.09 for the LTD group. A, Resting membrane potential was calculated as a mean voltage during 1 sec of recording (collected 5 sec after each 0.1 Hz afferent stimulation) averaged for 30 consecutive interstimulus intervals within the period between the 5th and 10th min of recording before pairing and for the 30 consecutive interstimulus intervals between the 25th and 30th min after pairing. The mean membrane potentials ± SD = -69.8 ± 3.1 mV (LTP group; n = 48; upward triangle), -68.6 ± 3.2 mV (NC group; n = 23; circle), and -70.0 ± 3.1 mV (LTD group; n = 39; downward triangle). No groups were significantly different from the others (p > 0.1). B, Initial EPSP amplitudes were measured as a difference between baseline and peak and averaged for 30 consecutive synaptic responses during the last 5 min of recording before pairing. The means ± SD for the initial EPSP amplitudes = 9.0 ± 1.3 mV (LTP group; n = 48; upward triangle), 8.8 ± 1.1 mV (no change group; n = 23; circle), and 9.1 ± 1.1 mV (LTD group; n = 39; downward triangle). No groups were significantly different from the others (p > 0.1). C, Level of depolarization was determined as a mean voltage of a steady state achieved in each depolarizing pulse (usually the last 10-15 msec of the pulse) and averaged between all 60 responses of a given cell to pairings. The means ± SD for the level of postsynaptic depolarization = -7.8 ± 6.0 mV (LTP group; n = 48; upward triangle), -5.4 ± 7.0 mV (no change group; n = 23; circle), and 8.2 ± 5.8 mV (LTD group; n = 39; downward triangle). No groups were significantly different from the others (p > 0.1). D, Depolarization amplitude was calculated as a difference between the resting membrane potential and the depolarization level in each given cell. The means ± SD for the depolarization amplitudes = 60.8 ± 5.4 mV (LTP group; n = 48; upward triangle), 61.7 ± 7.2 mV (no change group; n = 23; circle), and 60.2 ± 5.6 mV (LTD group; n = 39; downward triangle). No groups were significantly different from the others (p > 0.1). E, The input resistance change was calculated as the ratio of Rin 25-30 min after pairing over that during the 5 min period before pairing. The calculation of each Rin value was obtained from Ohm's law based on the measurement of the level of steady-state membrane hyperpolarization at the end of a 180 msec, -0.2 nA current pulse applied 1 sec after the afferent stimulus. The means ± SD for the Rin changes = +5.21 ± 5.43% (LTP group; n = 48; upward triangle), +4.51 ± 5.13% (no change group; n = 23; circle), and +3.44 ± 6.14% (LTD group; n = 39; downward triangle). No groups were significantly different from the others (p>0.1). F, The animals' ages were expressed in postnatal days (PND). The means ± SD for the animals' ages = 8.46 ± 1.88 d (LTP group; n = 48; upward triangle), 8.43 ± 1.85 d (no change group; n = 23; circle), and 8.23 ± 1.84 d (LTD group; n = 39; downward triangle). No groups were significantly different from the others (p > 0.1).
Figure 4.
Figure 4.
Analysis of initial (during prepairing control period) EPSP waveform and latency of the EPSPs for the entire group (n = 110) with whole-cell recording inresponse to layer 6 stimulation and with fura-4F present. A, Overlay of 30 individual traces of 60 total evoked EPSPs during 10 min prepairing control period for a typical cell. The stimulus artifact indicating layer 6 stimulation is evident at time 0.Em = -67 mV. EPSPs are 9-12 mV peak amplitude. B, Example of analysis of an individual EPSP (1 of the 30 traces shown in A). The solid line that overlays the individual raw trace is the fitted function described by the following: Em = Em0 + a * (1 - exp(-x/t1))n * exp(-x/t2) with the following fitting parameters Em0 = -65.7; a = 53.2; t1 = 3.3; t2 = 45.3; n = 2.5 × 10⁷. Triangle indicates EPSP onset; squares indicate 20 and 80% of peak values for calculation of EPSP rise time; circle indicates EPSP peak amplitude; all values were obtained from the fitted averaged EPSP. These parameters for this example EPSP are as follows: peak time = 21.7 msec; EPSP peak = -53.7 mV; resting Em = -65.7 mV; one SD from the resting Em = 0.21 mV; EPSP onset = resting Em + 2 SDs = -65.3 mV; onset latency = 8.0 msec; 20% of EPSP peak = -63.3 mV; time to 20% of EPSP peak = 11.0 msec; 80% of EPSP peak = -56.1 mV; time to 80% of EPSP peak = 16.0 msec (all times are referenced to the afferent stimulation); 20-80% slope = 1.46 mV/msec.C, Scatter plot of individual (crosses) mean EPSP onset latencies (abscissa) versus the relative changes in EPSP peak amplitude (ordinate) for all cells in the three plasticity outcome groups. Means ± SD of ratios of postpairing to prepairing average EPSP peak amplitudes plotted along the ordinate are the same as those in Figure 2. Means ± SDs for the onset latencies are as follows for the three plasticity outcome groups: LTP =6.37 ± 0.76 msec (n = 48), upward triangle; no change = 6.64 ± 0.75 msec (n= 23), circle; LTD = 6.43 ± 0.72 msec (n = 39), downward triangle. None of the groups are significantly different from each other (p > 0.1). D, Scatter plot of individual (crosses) variances (SDs, abscissa) of the onset latencies versus the relative changes in EPSP peak amplitude (ordinate) for all cells in the three plasticity outcome groups. Mean variances for each plasticity outcome group are indicated ± SD; LTP = 0.63 ± 0.09 msec (n = 48), upward triangle; no change = 0.64 ± 0.10 msec (n = 23), circle; LTD = 0.65 ± 0.10 msec (n = 39), downward triangle. None of the groups are significantly different from the others (p > 0.1). E, Scatter plot of the individual (crosses) mean latencies to the EPSP peak versus the relative changes in EPSP peak amplitude (ordinate) for all cells in the three plasticity outcome groups. Mean latencies for each plasticity outcome group are indicated ± SD; LTP = 19.26 ± 3.40 msec (n = 48), upward triangle; no change = 17.56 ± 3.57 msec (n = 23), circle; LTD = 18.26 ± 3.10 msec (n = 39), downward triangle. None of the groups are significantly different from the others (p > 0.1). F, Scatter plot of the individual (crosses) variances (SDs, abscissa) of the peak latencies versus the relative changes in EPSP peak amplitude (ordinate) for all cells in the three plasticity outcome groups. Mean variances for each plasticity outcome group are indicated ± SD; LTP = 1.83 ± 0.74 msec (n = 48), upward triangle; no change = 2.03 ± 1.01 msec (n = 23), circle; LTD = 1.84 ± 0.94 msec (n = 39), downward triangle. None of the groups are significantly different from the others (p > 0.1).
Figure 6.
Figure 6.
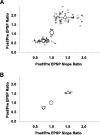
Scatter plots of individual (crosses) postpairing/prepairing EPSP peak amplitude ratios (ordinate) versus the ratios of postpairing/prepairing slopes of the rising phases of the EPSPs (abscissa). Slope ratios were taken as the 20-80% rise time at 25-30 min postpairing divided by the 20-80% rise time during the last 5 min of the prepairing control period, as described in Figure 4.A, Cells evaluated with layer 6 stimulation in which fura-4F was used (n = 110). As in previous figures, upward triangle indicates LTP group, circle indicates no change group, and downward triangle indicates LTD group. The mean ± SD for the slopes for the three outcome groups are 1.41 ± 0.27 mV/msec for the LTP group, 1.00 ± 0.03 mV/msec for the no change group, and 0.75 ± 0.17 mV/msec for the LTD group. The slopes between the three groups are significantly different (p < 0.001 for the LTD vs NC group, and p < 0.001 for the NC vs LTD group). B, Cells evaluated with layer 4 stimulation in which fura-4F was not used (n = 14). Upward triangle indicates LTP group, circle indicates no change group, and downward triangle indicates LTD group. The mean ± SD for the slopes for the three outcome groups are 1.50 ± 0.08 mV/msec for the LTP group, 0.98 ± 0.03 mV/msec for the no change group, and 0.75 ± 0.04 mV/msec for the LTD group. The slopes between the three groups are significantly different (p < 0.001 for the LTD vs NC group, and p < 0.001 for the NC vs LTD group).
Figure 7.
Figure 7.
Analysis of potential contribution of spike timing to plasticity. A, Examples of 30 overlaid traces of sequential alternate depolarizations applied to a cell during the pairing procedure (for clarity purposes, only 30 of the 60 traces evoked during the control period are illustrated). Five spikes occurred during most applied depolarizations. Arrows indicate the time of the peaks of the first and second spikes for one depolarization in each group; dashed lines extend these time points to abscissa for comparison of spike time occurrences to evoked EPSP illustrated in B. B, Average of 60 control evoked EPSPs (30 of the 60 individual records used to construct this average are shown in A) to indicate timing relationship between spikes elicited during the pairing of the applied depolarizing pulses and the EPSP onset and peak. The triangle and dashed line indicate the time of the EPSP onset as derived from the averaged fitted functions (Fig.4); the circle and dotted line indicate the time of the EPSP peak as derived from the averaged fitted functions (Fig. 4). For this example, the EPSP onset latency = 7.3 msec and the latency to peak = 21.1 msec. The results illustrated below in C-F in which the timing relationship between the spikes and the EPSP onset and peak are plotted are derived following the procedure for each cell. C, Scatter plot of individual (crosses) ratios of EPSP peak amplitudes (postpairing/prepairing ratio; ordinate) versus time between the first spike elicited during the depolarizing pulse and the EPSP onset (abscissa). Large upward triangle, circle, and downward triangle indicate mean for the LTP, NC, and LTD groups, respectively ± SD (n = 110). Mean ± SDs for the three plasticity outcome groups are -7.09 ± 2.54 msec for the LTP group, -7.50 ± 2.03 msec for the no change group, and -7.41 ± 2.40 msec for the LTD group. None of these groups are significantly different from each others (p > 0.1). D, Scatter plot of individual (crosses) ratios of EPSP peak amplitudes (postpairing/prepairing ratio; ordinate) versus time between the second spike elicited during the depolarizing pulse and the EPSP onset (abscissa). Large upward triangle, circle, and downward triangle indicate mean for the LTP, NC, and LTD groups, respectively, ± SD (n=110). Mean ± SDs for the three plasticity outcome groups are 3.64 ± 3.77 msec for the LTP group, 4.25 ± 3.89 msec for the no change group, and 4.12 ± 3.32 msec for the LTD group. None of these groups are significantly different from each other (p > 0.1). E, Scatter plot of individual (crosses) ratios of EPSP peak amplitudes (postpairing/prepairing ratio; ordinate) versus time between the first spike elicited during the depolarizing pulse and the EPSP peak (abscissa). Large upward triangle, circle, and downward triangle indicate mean for the LTP, NC, and LTD groups, respectively, ± SD (n = 110). Mean ± SDs for the three plasticity outcome groups are -19.98 ± 4.01 msec for the LTP group, -18.42 ± 3.88 msec for the no change group, and -19.24 ± 3.94 msec for the LTD group. None of these groups are significantly different from each other (p > 0.1). F, Scatter plot of individual (crosses) ratios of EPSP peak amplitudes (postpairing/prepairing ratio; ordinate) versus time between the second spike elicited during the depolarizing pulse and the EPSP peak (abscissa). Large upward triangle, circle, and downward triangle indicate grand mean for the LTP, NC, and LTD groups, respectively, ± SD (n = 110). Mean ± SDs for the three plasticity outcome groups are -9.26 ± 4.95 msec for the LTP group, -6.67 ± 5.19 msec for the no change group, and -7.70 ± 4.56 msec for the LTD group. None of these groups are significantly different from each other (p > 0.1).
Figure 10.
Figure 10.
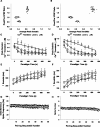
Summary of calcium transients during sequential pairings or application of depolarizing pulses alone and their relationship to electrophysiological responses. A, B, Scatter plot of the ratios of the average EPSP peak amplitude postpairing/prepairing (ordinate) versus the average peak somatic (A) and dendritic (B) calcium transient peak levels (abscissa) for cells subjected to pairing with fura-4F in the pipette solution in response to layer 6 stimulation as measured using the fast-frame calcium imaging protocol (n = 26). Shown is the average peak amplitude of all 10 Ca2+ transients (in response to every 6th successive pairing), as determined in the proximal apical dendrite (25-100 μm away from the cell body) and in the soma of each given cell. Before averaging, absolute peak parameters of individual calcium transients were determined using a third-order piecewise polynomial interpolation of the data. Symbols and bidirectional error bars represent means ± SDs for the respective sets of data in the LTP (upward triangle; n = 11), no change (circle; n = 6), and LTD (downward triangle; n = 9) groups and the depolarization only group (square; n = 11). C, D, The absolute peak levels of individual Ca2+ transients (ordinate) in response to every sixth consecutive pairing (or depolarization) over the course of the protocol (abscissa) were determined in the soma (C) and apical dendrite (D) as described for A1 and A2. Symbols represent means ± SEMs as follows: upward triangle = LTP group, circle = NC group, and downward triangle = LTD group. Responses to respective successive pairings averaged between 11 cells exhibiting potentiation, 6 cells that displayed no change in synaptic strength, and 9 cells that underwent LTD, respectively, are illustrated. Squares and error bars represent mean ± SEM of the responses to respective consecutive depolarizations alone averaged for the eight cells subjected to a 0.1 Hz train of 60 intracellular depolarizations without afferent stimulation. Solid lines in the graphs represent linear fits of the data in the LTP group with slopes for the somatic (C) and dendritic (D) measurements, respectively. Dotted, dashed, and mixed dashed-dotted lines represent the average of the individual single exponential fits of the time course of the decline of the dendritic and somatic calcium transients over the course of the conditioning protocol in the no change, LTD, and depolarization only groups, respectively. E, F, Symbols and error bars represent the mean ± SEM of the time constants (ordinate) derived from single exponential fits of the decay phase of the individual calcium transients in response to every sixth pairing or depolarization over the course of the conditioning protocol for the LTP (upward triangle), no change (circle), LTD (downward triangle), and depolarization only (square) groups as described in A and B. G, H, Symbols and error bars represent the mean ± SEM of instantaneous frequency and number of spikes elicited in the respective groups with regard to the pairing-induced plasticity outcomes (upward triangles, LTP; circles, no change; downward triangles, LTD) or in the depolarization only group (squares).
Figure 11.
Figure 11.
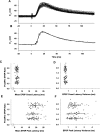
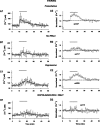
Dynamics of cumulative intracellular [Ca2+] associated with the development of synaptic plasticity changes for cells subjected to pairing with Fura-4F in the whole-cell recording pipette solution in response to layer 6 stimulation as measured using the slow-imaging method (n = 84). Shaded bars above all graphs represent 10 min pairing period (A1, A2, B1, B2, C1, C2) or period of application of depolarizing pulses alone (D1, D2). A1-C1, Data points represent cumulative somatic [Ca2+] in three individual cells, exhibiting potentiation, no change in synaptic strength, and depression, respectively. Free cytosolic Ca2+ concentrations were calculated from the background-subtracted ratiometric images collected once every 20 sec throughout the experiment within a single ROI placed on the soma (see Materials and Methods and Fig. 8 for details of image acquisition and calculation of [Ca2+]i). For the associated recordings of EPSP amplitude in the same three individual cells, see Figure 1 (B1-D1, respectively). Solid lines in the graph represent a linear regression of the data during control recording (10 min before pairing). Dotted and dashed lines represent a linear and a single exponential fit of the rise and decay phases of the recordings, respectively. For all fits and for calculation of the numeric values for the time and level of peak sustained intracellular [Ca2+]i (determined using a third-order piecewise polynomial interpolation), the data were first smoothed by a three-point moving average routine. A2-C2, Normalized changes in sustained somatic [Ca2+]i in response to pairing in the groups of cells exhibiting potentiation (A2; n = 37), no change in synaptic strength (B2; n = 17), and depression (C2; n = 3), respectively, from the sample of 84 cells (every other data point is illustrated for graphical clarity). Time plots of grouped data (symbols and error bars indicate means ± SEM) were constructed using all data points in the individual recordings of intracellular Ca2+ normalized for the mean value of intracellular [Ca2+] at rest (last 5 min of control recording) and averaged for the respective number of cells. D1, D2, Recordings of the sustained somatic [Ca2+] in an individual neuron and in a sample of 11 cells subjected to a 0.1 Hz train of 60 intracellular depolarizations to approximately -10 mV (without afferent stimulation), respectively. For the EPSP data in the same individual cell, see Figure 1 E1. The horizontal dashed lines indicate the normalized baseline response = 1.0 for the grouped results.
Figure 8.
Figure 8.
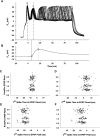
Timing diagram for the experimental paradigm and the optical data acquisition protocol. A, Red lines in the graph indicate the 0.1 Hz afferent stimuli to evoke an EPSP. The superimposed black lines indicate timing of the 100 msec depolarizing pulses coincident with synaptic stimulation (onset of depolarization 10 msec before the afferent stimulus) for the 10 min pairing epoch. B, Determination of the resting baseline intracellular Ca2+ level was made by taking the fluorescence images in pairs during the control period (10-20 msec frame readout interval) at the calibrated excitation maxima of Ca2+-bound and Ca2+-free forms of fura-4F (354 and 374 nm, respectively), thus generating ratios once every 20 sec. In addition, when continued throughout the entire experiment, this mode of optical data acquisition allowed us to monitor slow dynamics of sustained intracellular Ca2+ during development and expression of synaptic plasticity. C, To record fast intracellular Ca2+ dynamics in response to individual pairings, a string of 60 images was taken in a sequence at a single Ca2+-sensitive wavelength (374 nm) every 30 msec starting 200 msec before the onset of depolarization and lasting for 1.8 sec. A pair of F2 frames at calibrated isoasbestic wavelength of 358 nm was taken before and after this string to generate ratiometric images. To minimize photo damage to the cells, only responses to every sixth pairing (once every 60 sec) were studied. Expanded time-scale diagrams (B, C) illustrate the timing of ratiometric image capture with respect to the afferent stimulus (and/or depolarization), with the pink line indicating the exposure of the cell to the monochromatic light of appropriate wavelengths. D, E, Representative pseudocolor background-subtracted ratiometric images of a fura-4F-filled neuron from each method are shown below the respective timing diagrams. Colored rectangles in the images over the somata and apical dendrites indicate the ROIs, which is where calcium measurements were typically made. The white rectangles outside the labeled cell in each image represent typical placement of an ROI to determine background fluorescence. Scale bars, 10 μm. Pseudocolor scale indicates calcium concentration.
Figure 9.
Figure 9.
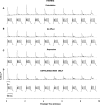
Intracellular Ca2+ responses to individual pairings during the induction of synaptic plasticity as measured with fura-4F with whole-cell recording in response to layer 6 stimulation. For each pair of traces, the top rows are recordings of fast [Ca2+] dynamics in the dendrites of an example cell that underwent LTP (A), no change (B), or LTD (C), respectively, or received only depolarizing pulses without synaptic stimulation (D). To minimize photo damage to the cells, only responses to every sixth pairing (once every 60 sec) were studied. Bottom rows depict recordings of electrophysiological responses to respective pairings-depolarizations in the same cells.
Figure 12.
Figure 12.
Synaptic plasticity outcome as a function of sustained intracellular Ca2+ levels measured over the course of the protocol (n = 84). Crosshair symbols represent the sustained [Ca2+]i parameters (abscissa) as determined for each cell versus the ratio of the postpairing/prepairing EPSP peak amplitude (ordinate). Symbols and bidirectional error bars represent means ± SD (values given in Results) for the respective sets of data in the LTP (upward triangle; n = 37), no change (circle; n = 17), and LTD (downward triangle; n = 30) groups for all panels in this figure. A, The peak sustained [Ca2+]i level was determined using a third-order piecewise polynomial interpolation of the data that were smoothed by a three-point moving average routine. B, The peak sustained [Ca2+]i rise amplitude was calculated as the difference in the peak sustained calcium level (A) and the initial calcium level (C). C, The initial [Ca2+]i was determined as a mean of the 15 measurements during the last 5 min of control recording. D, The residual [Ca2+]i was determined as the mean value of the 15 consecutive [Ca2+]i measurements made between the 25th and 30th min after pairing. E, The sustained rise time of [Ca2+]i is the time necessary to reach the peak sustained [Ca2+]i level in each cell and was determined using a third-order piecewise polynomial interpolation of the three-point moving average smoothed data. F, The decay time of the sustained [Ca2+]i is the time necessary to reach a residual steady-state [Ca2+]i level in each cell and was determined by using a single exponential fit of the three-point moving average smoothed data after the peak sustained [Ca2+]i.

Similar articles

Cited by

References

    1. Abraham WC, Bear MF (1996) Metaplasticity: the plasticity of synaptic plasticity. Trends Neurosci 19: 126-130. - PubMed
    1. Artola A, Singer W (1993) Long-term depression of excitatory synaptic transmission and its relationship to long-term potentiation. Trends Neurosci 16: 480-487. - PubMed
    1. Artola A, Brocher S, Singer W (1990) Different voltage-dependent thresholds for inducing long-term depression and long-term potentiation in slices of rat visual cortex. Nature 347: 69-72. - PubMed
    1. Bear MF (2003) Bidirectional synaptic plasticity: from theory to reality. Philos Trans R Soc Lond B Biol Sci 358: 649-655. - PMC - PubMed
    1. Bear MF, Cooper LN, Ebner FF (1987) A physiological basis for a theory of synapse modification. Science 237: 42-48. - PubMed

Publication types

MeSH terms

LinkOut - more resources