. 2004 Sep;24(18):7931-40.
doi: 10.1128/MCB.24.18.7931-7940.2004.

Nuclear receptors CAR and PXR cross talk with FOXO1 to regulate genes that encode drug-metabolizing and gluconeogenic enzymes

Affiliations

Nuclear receptors CAR and PXR cross talk with FOXO1 to regulate genes that encode drug-metabolizing and gluconeogenic enzymes

Susumu Kodama et al. Mol Cell Biol. 2004 Sep.

Abstract

The nuclear receptors CAR and PXR activate hepatic genes in response to therapeutic drugs and xenobiotics, leading to the induction of drug-metabolizing enzymes, such as cytochrome P450. Insulin inhibits the ability of FOXO1 to express genes encoding gluconeogenic enzymes. Induction by drugs is known to be decreased by insulin, whereas gluconeogenic activity is often repressed by treatment with certain drugs, such as phenobarbital (PB). Performing cell-based transfection assays with drug-responsive and insulin-responsive enhancers, glutathione S-transferase pull down, RNA interference (RNAi), and mouse primary hepatocytes, we examined the molecular mechanism by which nuclear receptors and FOXO1 could coordinately regulate both enzyme pathways. FOXO1 was found to be a coactivator to CAR- and PXR-mediated transcription. In contrast, CAR and PXR, acting as corepressors, downregulated FOXO1-mediated transcription in the presence of their activators, such as 1,4-bis[2-(3,5-dichloropyridyloxy)]benzene (TCPOBOP) and pregnenolone 16alpha-carbonitrile, respectively. A constitutively active mutant of the insulin-responsive protein kinase Akt, but not the kinase-negative mutant, effectively blocked FOXO1 activity in cell-based assays. Thus, insulin could repress the receptors by activating the Akt-FOXO1 signal, whereas drugs could interfere with FOXO1-mediated transcription by activating CAR and/or PXR. Treatment with TCPOBOP or PB decreased the levels of phosphoenolpyruvate carboxykinase 1 mRNA in mice but not in Car(-/-) mice. We conclude that FOXO1 and the nuclear receptors reciprocally coregulate their target genes, modulating both drug metabolism and gluconeogenesis.


Figures
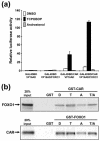
FIG. 1.
FIG. 1.
Direct binding of CAR to FOXO1. (a) Mammalian two-hybrid assay. The pG5-Luc reporter plasmid was cotransfected with various combinations of pBIND, pACT, pBIND/mCAR, and pACT/mFOXO1Ct into HepG2 cells. The amount of each plasmid was 0.2 μg, and the total amount of plasmids was adjusted by pcDNA3-V5-His. At 24 h after transfection, cells were treated with 0.1% DMSO, TCPOBOP (250 nM), or androstenol (10 μM) for an additional 24 h. Subsequently, cells were harvested and cell extracts were prepared for dual-luciferase assays. Relative activities were calculated by taking the activity obtained from the GAL4DBD- and VP16AD-transfected cells in the presence of DMSO as one. Bars indicate means ± standard deviation. (b) GST pull-down assay. In vitro-translated 35S-labeled FOXO1 and CAR were incubated with bacterially expressed GST-mFOXO1 and GST-mCAR fusion proteins, respectively, in the presence of 0.1% DMSO, 1 μM TCPOBOP (T), 10 μM androstenol (A), or both (T/A). GST was used as a negative control for binding. Sodium dodecyl sulfate-polyacrylamide gel electrophoresis and autoradiography were done as described in Materials and Methods.
FIG. 2.
FIG. 2.
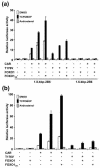
Coactivation of CAR by FOXO1 in HepG2 cells. (a) Transient transfection assays were performed by cotransfecting pCR3/mCAR, pcDNA/T176V, pcDNA3/mFOXO1, or pcDNA3/mFOXO13A with 1.8 kbp-2B6-Luc or 1.6 kbp-2B6-Luc reporter plasmid into HepG2 cells. (b) XREM-3A4-Luc plasmid was used as the reporter. The amount of each plasmid was 0.2 μg, and the total amount of plasmid in an assay was adjusted by using an empty plasmid. Cells were treated as described in the legend to Fig. 1. Relative activities were calculated by taking the activity of the cells that were transfected by only the reporter plasmid in the presence of DMSO as one. Bars indicate means ± standard deviations.
FIG. 3.
FIG. 3.
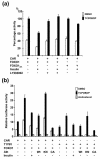
Regulation by rAkt of coactivation of CAR by FOXO1. Either pCR3/mCAR or pCR3/T176V was cotransfected with pcDNA3/mFOXO1, pcDNA3/rAktWt, pcDNA3/rAktKN, and/or pcDNA3/rAktCA into HepG2 cells. In addition, the 1.8 kbp-2B6-Luc reporter was also cotransfected. Except for the cases of insulin (500 nM) and LY294002 (20 μM), the drug concentrations of all treatments and cultures were the same as those described in the legend to Fig. 1. (a) Differential effects of insulin on the wild-type and mutant FOXO1-mediated CAR activities. The percentage of activity relative to the CAR- and FOXO1/FOXO13A-transfected cells in the presence of TCPOBOP is given as 100. Bars indicate means ± standard deviations. (b) Differential effects of the wild-type and mutated Akts on the FOXO1-mediated CAR activity. Relative activities were calculated by taking the activity of the cells that were transfected by only the reporter plasmid in the presence of DMSO as one.
FIG. 4.
FIG. 4.
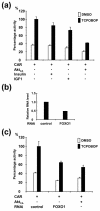
Regulation of CAR activity by endogenous FOXO1. (a) Transient transfection assays. The 1.8 kbp-2B6-Luc reporter and pCR3/mCAR were cotransfected with or without pcDNA3/rAktCA into HepG2 cells. Cells were cultured and treated with insulin, IGF1, and/or TCPOBOP as described in the legend to Fig. 1. Relative fold activities were calculated by taking the activity of the cells that were transfected with the pCR3/mCAR and 1.8 kbp-2B6-Luc plasmids in the presence of TCPOBOP as 100. Bars indicate means ± standard deviations. (b) Real-time PCR. HepG2 cells were transfected with FOXO1 RNAi (50 pmol) or control oligonucleotides (50 pmol) in MEM supplemented with 10% fetal bovine serum for 48 h and MEM containing 5% charcoal dextran-treated fetal calf serum for another 24 h. Total RNA was extracted for real-time PCR analysis with specific probes for FOXO1 mRNA. (c) Transient transfection assay. pCR3/mCAR and 1.8 kbp-2B6-Luc plasmids were cotransfected in the presence of FOXO1 RNAi or control RNAi. Cells were cultured and treated as described above. Relative activities were calculated by taking the activity of the cells that were transfected with the pCR3/mCAR and 1.8 kbp-2B6-Luc plasmids in the presence of TCPOBOP and control RNAi as 100.
FIG. 5.
FIG. 5.
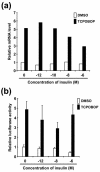
Repression of the Cyp2b10 gene by insulin in mouse primary hepatocytes. (a) Mouse primary hepatocytes were prepared and treated with 0.1% DMSO or 250 nM TCPOBOP in the presence of various concentrations of insulin ranging from 10−12 to 10−6 M. At 8 h after treatment, total RNA was extracted and subjected to real-time PCR analysis with specific probes for the Cyp2b10 gene. Relative levels were expressed by taking the level in DMSO-treated hepatocytes without insulin treatment as one. (b) Luciferase activity was measured 24 h after electroporation with pGL3/1.8 kbp-2B6-Luc (10 μg), pRL-CMV (5 μg), and drug treatment. Relative activities were calculated by taking the level in DMSO-treated hepatocytes without insulin treatment as one. Bars indicate means ± standard deviations.
FIG. 6.
FIG. 6.
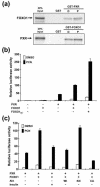
Regulation of PXR activity by FOXO1. (a) GST pull-down assay. In vitro-translated 35S-labeled FOXO1 and PXR were incubated with bacterially expressed GST-mFOXO1 and GST-mPXR, respectively, in the presence of 0.1% DMSO (D) or 50 μM PCN (P). (b) Transient transfection assay. XREM-3A4-Luc reporter was cotransfected with pcDNA3/mFOXO1 (or pcDNA3/mFOXO13A) and/or pcDNA3/mPXR into HepG2 cells. Cells were treated with drugs, and the activity was calculated as described in the legend to Fig. 1. In the case of PCN treatment, 10 μM was used to activate PXR. (c) Transient transfection assays. XREM-3A4-Luc reporter was cotransfected with pcDNA3/mPXR and pcDNA3/mFOXO1 into HepG2 cells. In some cases, cells were additionally transfected with pcDNA3/rAktWt, pcDNA3/rAktKN, or pcDNA3/rAktCA. PCN (10 μM) and insulin (500 nM) were used to treat cells. Relative activities were calculated by taking the activity of the cells that were transfected by only the reporter plasmid in the presence of DMSO as one. Bars indicate means ± standard deviations.
FIG. 7.
FIG. 7.
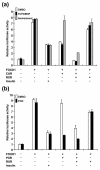
Repression by CAR and PXR of FOXO1-IRS activity. The IRS-tk-Luc reporter and pcDNA3/mFOXO1 were cotransfected with pCR3/mCAR (a) or pcDNA3/mPXR (b) into HepG2 cells. In some cases, pCMX/hRXR was additionally transfected. Relative activities were calculated by taking the activity of the cells that were transfected by only the reporter plasmid in the presence of DMSO as one. Bars indicate means ± standard deviations.
FIG. 8.
FIG. 8.
CAR and PXR inhibit FOXO1 binding to IRS. In vitro-translated FOXO1, CAR, hRXR, and PXR were incubated with the radiolabeled oligonucleotides for wild-type (w) and mutant (m) IRS. For antibody supershift assays, unlabeled oligonucleotides, rabbit immunoglobulin G, and hFOXO1 antibody were cotreated (lane 2 and 3). Excess amounts of unlabeled wIRS and mIRS (25× and 250×) were used for competitive assays (lanes 4 to 7). Gel shift assays were performed as described in Materials and Methods. Band intensity of the IRS-FOXO1 complex was measured with Gene Tools (Hitachi Software Engineering Co., Ltd.).
FIG. 9.
FIG. 9.
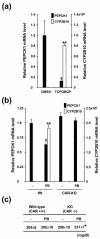
CAR regulates the Pepck1 gene. Male mice were treated as described in Materials and Methods. (a) Liver RNA samples were individually prepared from three mice for each group of Cr1:CD-1(ICR)BR mice and were individually subjected to real-time PCR analysis with specific probes for PEPCK1 and CYP2B10 mRNAs, respectively. Relative mRNA levels were expressed by taking those with DMSO as one. Values are means ± standard errors of the means. An asterisk indicates a P value of <0.05 and a double asterisk indicates a P value of <0.0001 for PEPCK1 and CYP2B10 mRNAs, respectively, compared with those of the DMSO-treated mice. (b) Liver RNAs were prepared from 12 mice for each of the Car−/− and Car+/+ groups and were individually subjected to real-time PCR assay. Relative mRNA levels were expressed by taking those with no PB treatment as one (± standard errors of the mean). An asterisk indicates P < 0.02 and a double asterisk indicates P < 0.0001 for PEPCK1 and CYP2B10 mRNAs, respectively, compared with those of the mice not treated with PB. (c) Serum glucose levels of the Car−/− and Car+/+ mice. Serum was collected from 20 for each group of the Car−/− and Car+/+ mice. The glucose level was individually measured using the COBAS MIRA Plus CC Analyzer (Roche Diagnostics) and was averaged. KO, knockout.
FIG. 10.
FIG. 10.
Schematic representation of cross-talk. Arrows indicate activation and coactivation, while stop bars indicate repression and corepression.

Similar articles

Cited by

References

    1. Argaud, D., S. Halimi, F. Catelloni, and X. M. Leverve. 1991. Inhibition of gluconeogenesis in isolated rat hepatocytes after chronic treatment with phenobarbital. Biochem. J. 280:663-669. - PMC - PubMed
    1. Biggs, W. H., III, J. Meisenhelder, T. Hunter, W. K. Cavenee, and K. C. Arden. 1999. Protein kinase B/Akt-mediated phosphorylation promotes nuclear exclusion of the winged helix transcription factor FKHR1. Proc. Natl. Acad. Sci. USA 96:7421-7426. - PMC - PubMed
    1. Dixon, R. L., L. G. Hart, and J. R. Fouts. 1961. The metabolism of drugs by liver microsomes from alloxan-diabetic rats. J. Pharmacol. Exp. Ther. 133:7-11. - PubMed
    1. Dowell, P., T. C. Otto, S. Adi, and M. D. Lane. 2003. Convergence of proxisome proliferator-activated receptor-γ and Foxo1 signaling pathway. J. Biol. Chem. 278:45485-45491. - PubMed
    1. Goodwin, B., M. R. Redinbo, and S. A. Kliewer. 2002. Regulation of cyp3a gene transcription by the pregnane x receptor. Annu. Rev. Pharmacol. Toxicol. 42:1-23. - PubMed

MeSH terms