

Nuclear body movement is determined by chromatin accessibility and dynamics
- PMID: 15331777
- PMCID: PMC516551
- DOI: 10.1073/pnas.0402958101
Nuclear body movement is determined by chromatin accessibility and dynamics
Abstract
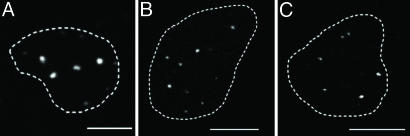
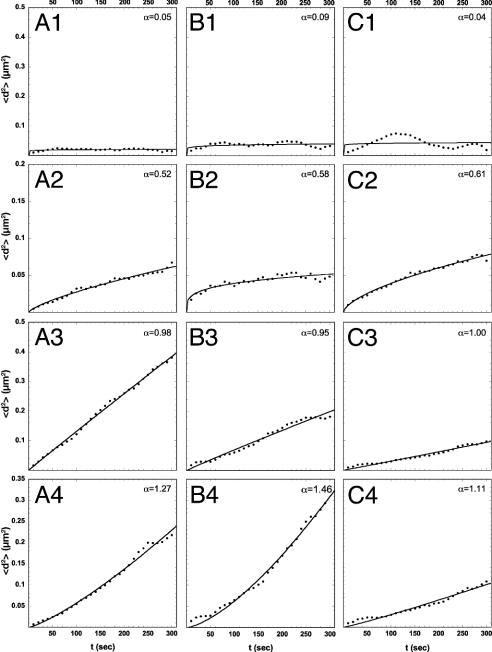
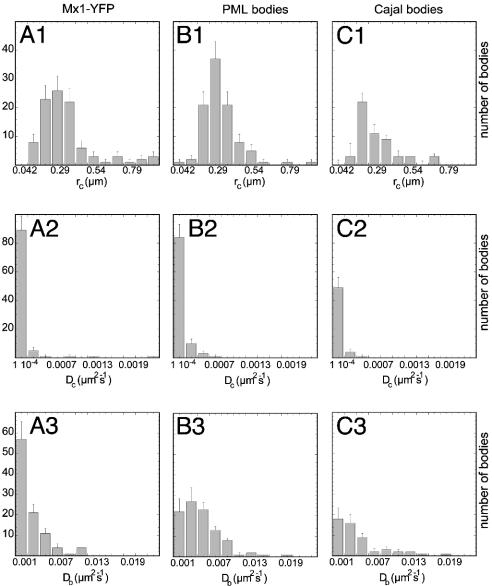
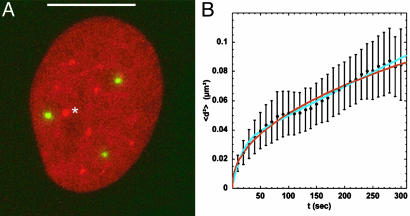
Promyelocytic leukemia (PML) and Cajal bodies are mobile subnuclear organelles, which are involved in activities like RNA processing, transcriptional regulation, and antiviral defense. A key parameter in understanding their biological functions is their mobility. The diffusion properties of PML and Cajal bodies were compared with a biochemically inactive body formed by aggregates of murine Mx1 by using single-particle tracking methods. The artificial Mx1-yellow fluorescent protein body showed a very similar mobility compared with PML and Cajal bodies. The data are described quantitatively by a mechanism of nuclear body movement consisting of two components: diffusion of the body within a chromatin corral and its translocation resulting from chromatin diffusion. This finding suggests that the body mobility reflects the dynamics and accessibility of the chromatin environment, which might target bodies to specific nuclear subcompartments where they exert their biological function.
Figures


Similar articles
-
[Nuclear and chromatin dynamics].Tanpakushitsu Kakusan Koso. 2006 Apr;51(4):302-9. Tanpakushitsu Kakusan Koso. 2006. PMID: 16613166 Review. Japanese. No abstract available.
-
Mobility of multi-subunit complexes in the nucleus: accessibility and dynamics of chromatin subcompartments.Histochem Cell Biol. 2005 Mar;123(3):217-28. doi: 10.1007/s00418-005-0752-y. Epub 2005 Apr 14. Histochem Cell Biol. 2005. PMID: 15830242 Review.
-
[Nuclear organelles in the interchromosomal region].Tanpakushitsu Kakusan Koso. 2006 Nov;51(14 Suppl):1957-63. Tanpakushitsu Kakusan Koso. 2006. PMID: 17471892 Review. Japanese. No abstract available.
-
Role of the promyelocytic leukemia body in the dynamic interaction between the androgen receptor and steroid receptor coactivator-1 in living cells.Mol Endocrinol. 2003 Jan;17(1):128-40. doi: 10.1210/me.2002-0165. Mol Endocrinol. 2003. PMID: 12511612
-
Cajal body dynamics and association with chromatin are ATP-dependent.Nat Cell Biol. 2002 Jul;4(7):502-8. doi: 10.1038/ncb809. Nat Cell Biol. 2002. PMID: 12068306
Cited by
-
Progressive polycomb assembly on H3K27me3 compartments generates polycomb bodies with developmentally regulated motion.PLoS Genet. 2012 Jan;8(1):e1002465. doi: 10.1371/journal.pgen.1002465. Epub 2012 Jan 19. PLoS Genet. 2012. PMID: 22275876 Free PMC article.
-
Effect of ATP binding and hydrolysis on dynamics of canine parvovirus NS1.J Virol. 2010 May;84(10):5391-403. doi: 10.1128/JVI.02221-09. Epub 2010 Mar 10. J Virol. 2010. PMID: 20219935 Free PMC article.
-
Live cell microscopy analysis of radiation-induced DNA double-strand break motion.Proc Natl Acad Sci U S A. 2009 Mar 3;106(9):3172-7. doi: 10.1073/pnas.0810987106. Epub 2009 Feb 12. Proc Natl Acad Sci U S A. 2009. PMID: 19221031 Free PMC article.
-
Size distributions of intracellular condensates reflect competition between coalescence and nucleation.Nat Phys. 2023;19(4):586-596. doi: 10.1038/s41567-022-01917-0. Epub 2023 Feb 2. Nat Phys. 2023. PMID: 37073403 Free PMC article.
-
Adenoviral vectors stimulate glucagon transcription in human mesenchymal stem cells expressing pancreatic transcription factors.PLoS One. 2012;7(10):e48093. doi: 10.1371/journal.pone.0048093. Epub 2012 Oct 26. PLoS One. 2012. PMID: 23110179 Free PMC article.
References
Publication types
MeSH terms
Substances
LinkOut - more resources
Full Text Sources
