Global effects of human papillomavirus type 18 E6/E7 in an organotypic keratinocyte culture system
- PMID: 15308700
- PMCID: PMC506920
- DOI: 10.1128/JVI.78.17.9041-9050.2004
Global effects of human papillomavirus type 18 E6/E7 in an organotypic keratinocyte culture system
Abstract
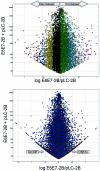
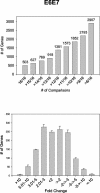
The effects of human papillomavirus type 18 (HPV-18) E6 and E7 proteins on global patterns of host gene expression in primary human keratinocytes grown in organotypic raft culture system were assessed. Primary human keratinocytes were infected with retroviruses that express the wild-type HPV-18 E6 and E7 genes from the native differentiation-dependent HPV enhancer-promoter. Total RNA was isolated from raft cultures and used to generate probes for querying Affymetrix U95A microarrays, which contain >12,500 human gene sequences. Quadruplicate arrays of each E6/E7-transduced and empty vector-transduced samples were analyzed by 16 pairwise comparisons. Transcripts altered in > or =12 comparisons were selected for further analysis. With this approach, HPV-18 E6/E7 expression significantly altered the expression of 1,381 genes. A large increase in transcripts associated with DNA and RNA metabolism was observed, with major increases noted for transcription factors, splicing factors, and DNA replication elements, among others. Multiple genes associated with protein translation were downregulated. In addition, major alterations were found in transcripts associated with the cell cycle and cell differentiation. Our study provides a systematic description of transcript changes brought about by HPV-18 E6/E7 in a physiologically relevant model and should furnish a solid source of information to guide future studies.
Figures


Similar articles
-
Papillomavirus type 16 oncogenes downregulate expression of interferon-responsive genes and upregulate proliferation-associated and NF-kappaB-responsive genes in cervical keratinocytes.J Virol. 2001 May;75(9):4283-96. doi: 10.1128/JVI.75.9.4283-4296.2001. J Virol. 2001. PMID: 11287578 Free PMC article.
-
Human papillomavirus type 16 E6 and E7 proteins inhibit differentiation-dependent expression of transforming growth factor-beta2 in cervical keratinocytes.Cancer Res. 2000 Aug 1;60(15):4289-98. Cancer Res. 2000. PMID: 10945644
-
Tetrasomy is induced by human papillomavirus type 18 E7 gene expression in keratinocyte raft cultures.Cancer Res. 2001 Jun 15;61(12):4858-63. Cancer Res. 2001. PMID: 11406563
-
Control of human papillomavirus gene expression by alternative splicing.Virus Res. 2017 Mar 2;231:83-95. doi: 10.1016/j.virusres.2016.11.016. Epub 2016 Nov 17. Virus Res. 2017. PMID: 27867028 Free PMC article. Review.
-
Selection and validation of candidate housekeeping genes for studies of human keratinocytes--review and recommendations.J Invest Dermatol. 2009 Mar;129(3):535-7. doi: 10.1038/jid.2008.428. J Invest Dermatol. 2009. PMID: 19209154 Review.
Cited by
-
Functional interaction between human papillomavirus type 16 E6 and E7 oncoproteins and cigarette smoke components in lung epithelial cells.PLoS One. 2012;7(5):e38178. doi: 10.1371/journal.pone.0038178. Epub 2012 May 25. PLoS One. 2012. PMID: 22662279 Free PMC article.
-
Immunogenic properties of recombinant and synthetic peptides of Human papillomavirus.Dokl Biochem Biophys. 2008 Jul-Aug;421:185-90. doi: 10.1134/s1607672908040066. Dokl Biochem Biophys. 2008. PMID: 18853768 No abstract available.
-
Gene expression reveals two distinct groups of anal carcinomas with clinical implications.Br J Cancer. 2008 Apr 8;98(7):1264-73. doi: 10.1038/sj.bjc.6604285. Epub 2008 Mar 18. Br J Cancer. 2008. PMID: 18349847 Free PMC article.
-
Increased expression of RRM2 by human papillomavirus E7 oncoprotein promotes angiogenesis in cervical cancer.Br J Cancer. 2014 Feb 18;110(4):1034-44. doi: 10.1038/bjc.2013.817. Epub 2014 Jan 14. Br J Cancer. 2014. PMID: 24423925 Free PMC article.
-
Integrative analyses reveal novel strategies in HPV11,-16 and -45 early infection.Sci Rep. 2012;2:515. doi: 10.1038/srep00515. Epub 2012 Jul 17. Sci Rep. 2012. PMID: 22808421 Free PMC article.
References
-
- Baker, C., and C. Calef. 1997. Maps of papillomavirus mRNA transcripts. In G. Myers, F. Sverdrup, C. Baker, A. McBride, K. Münger, H.-U. Bernard, and J. Meissner (ed.), Human papillomaviruses, compendium, part III. Los Alamos National Laboratory, Los Alamos, N.Mex.
-
- Banks, L., C. Edmonds, and K. H. Vousden. 1990. Ability of the HPV16 E7 protein to bind RB and induce DNA synthesis is not sufficient for efficient transforming activity in NIH3T3 cells. Oncogene 5:1383-1389. - PubMed
-
- Barnard, P., and N. A. McMillan. 1999. The human papillomavirus E7 oncoprotein abrogates signaling mediated by interferon-α. Virology 259:305-313. - PubMed
-
- Barnard, P., E. Payne, and N. A. McMillan. 2000. The human papillomavirus E7 protein is able to inhibit the antiviral and anti-growth functions of interferon-α. Virology 277:411-419. - PubMed
MeSH terms
Substances
LinkOut - more resources
Full Text Sources

