

Expression profile of genes regulated by activity of the Na-H exchanger NHE1
- PMID: 15257760
- PMCID: PMC499544
- DOI: 10.1186/1471-2164-5-46
Expression profile of genes regulated by activity of the Na-H exchanger NHE1
Abstract
Background: In mammalian cells changes in intracellular pH (pHi), which are predominantly controlled by activity of plasma membrane ion exchangers, regulate a diverse range of normal and pathological cellular processes. How changes in pHi affect distinct cellular processes has primarily been determined by evaluating protein activities and we know little about how pHi regulates gene expression.
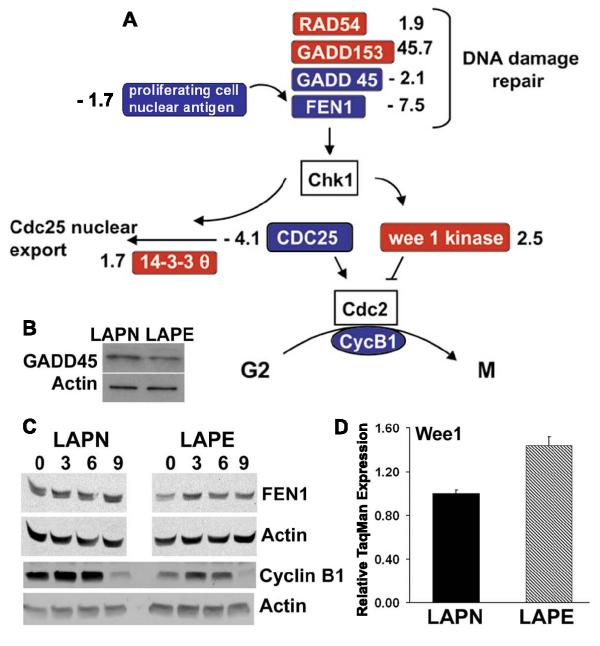
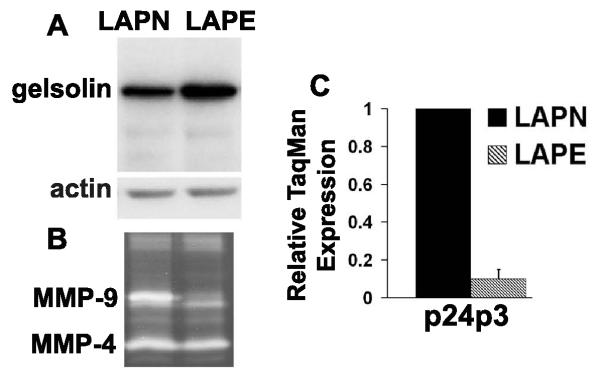
Results: A global profile of genes regulated in mammalian fibroblasts by decreased pHi induced by impaired activity of the plasma membrane Na-H exchanger NHE1 was characterized by using cDNA microarrays. Analysis of selected genes by quantitative RT-PCR, TaqMan, and immunoblot analyses confirmed results obtained from cDNA arrays. Consistent with established roles of pHi and NHE1 activity in cell proliferation and oncogenic transformation, grouping regulated genes into functional categories and biological pathways indicated a predominant number of genes with altered expression were associated with growth factor signaling, oncogenesis, and cell cycle progression.
Conclusion: A comprehensive analysis of genes selectively regulated by pHi provides insight on candidate targets that might mediate established effects of pHi on a number of normal and pathological cell functions.
Figures


Similar articles
-
Regulation of expression of the Na+/H+ exchanger by thyroid hormone.Vitam Horm. 2004;69:249-69. doi: 10.1016/S0083-6729(04)69009-1. Vitam Horm. 2004. PMID: 15196885 Review.
-
Na+/H+ exchanger 1 deficiency alters gene expression in mouse brain.Physiol Genomics. 2004 Aug 11;18(3):331-9. doi: 10.1152/physiolgenomics.00076.2004. Physiol Genomics. 2004. PMID: 15306696
-
Time-dependent activity of Na+/H+ exchanger isoform 1 and homeostasis of intracellular pH in astrocytes exposed to CoCl2 treatment.Mol Med Rep. 2016 May;13(5):4443-50. doi: 10.3892/mmr.2016.5067. Epub 2016 Mar 30. Mol Med Rep. 2016. PMID: 27035646
-
Functional role of arginine 425 in the mammalian Na⁺/H⁺ exchanger.Biochem Cell Biol. 2014 Dec;92(6):541-6. doi: 10.1139/bcb-2014-0070. Epub 2014 Aug 21. Biochem Cell Biol. 2014. PMID: 25350536
-
Physiological Functions and Regulation of the Na+/H+ Exchanger [NHE1] in Renal Tubule Epithelial Cells.Kidney Blood Press Res. 2015;40(5):452-66. doi: 10.1159/000368521. Epub 2015 Aug 25. Kidney Blood Press Res. 2015. PMID: 26304834 Review.
Cited by
-
Mislocalized scaffolding by the Na-H exchanger NHE1 dominantly inhibits fibronectin production and TGF-beta activation.Mol Biol Cell. 2009 Apr;20(8):2327-36. doi: 10.1091/mbc.e08-08-0842. Epub 2009 Feb 18. Mol Biol Cell. 2009. PMID: 19225158 Free PMC article.
-
The acid-base transport proteins NHE1 and NBCn1 regulate cell cycle progression in human breast cancer cells.Cell Cycle. 2018;17(9):1056-1067. doi: 10.1080/15384101.2018.1464850. Epub 2018 Jul 13. Cell Cycle. 2018. PMID: 29895196 Free PMC article.
-
[Pt(O,O'-acac)(γ-acac)(DMS)] alters SH-SY5Y cell migration and invasion by the inhibition of Na+/H+ exchanger isoform 1 occurring through a PKC-ε/ERK/mTOR Pathway.PLoS One. 2014 Nov 5;9(11):e112186. doi: 10.1371/journal.pone.0112186. eCollection 2014. PLoS One. 2014. PMID: 25372487 Free PMC article.
-
pH-regulated single cell migration.Pflugers Arch. 2024 Apr;476(4):639-658. doi: 10.1007/s00424-024-02907-2. Epub 2024 Jan 12. Pflugers Arch. 2024. PMID: 38214759 Free PMC article. Review.
-
Structural and Functional Changes in the Na+/H+ Exchanger Isoform 1, Induced by Erk1/2 Phosphorylation.Int J Mol Sci. 2019 May 14;20(10):2378. doi: 10.3390/ijms20102378. Int J Mol Sci. 2019. PMID: 31091671 Free PMC article. Review.
References
-
- Olson ER. Influence of pH on bacterial gene expression. Mol Microbiol. 1993;8:5–14. - PubMed
Publication types
MeSH terms
Substances
Grants and funding
LinkOut - more resources
Full Text Sources
Miscellaneous
