. 2004 Jul;114(2):280-90.
doi: 10.1172/JCI21583.

Expression of indoleamine 2,3-dioxygenase by plasmacytoid dendritic cells in tumor-draining lymph nodes

Affiliations

Expression of indoleamine 2,3-dioxygenase by plasmacytoid dendritic cells in tumor-draining lymph nodes

David H Munn et al. J Clin Invest. 2004 Jul.

Erratum in

  • J Clin Invest. 2004 Aug;114(4):599

Abstract

One mechanism contributing to immunologic unresponsiveness toward tumors may be presentation of tumor antigens by tolerogenic host APCs. We show that mouse tumor-draining LNs (TDLNs) contained a subset of plasmacytoid DCs (pDCs) that constitutively expressed immunosuppressive levels of the enzyme indoleamine 2,3-dioxygenase (IDO). Despite comprising only 0.5% of LN cells, these pDCs in vitro potently suppressed T cell responses to antigens presented by the pDCs themselves and also, in a dominant fashion, suppressed T cell responses to third-party antigens presented by nonsuppressive APCs. Adoptive transfer of DCs from TDLNs into naive hosts created profound local T cell anergy, specifically toward antigens expressed by the transferred DCs. Anergy was prevented by targeted disruption of the IDO gene in the DCs or by administration of the IDO inhibitor drug 1-methyl-D-tryptophan to recipient mice. Within the population of pDCs, the majority of the functional IDO-mediated suppressor activity segregated with a novel subset of pDCs coexpressing the B-lineage marker CD19. We hypothesize that IDO-mediated suppression by pDCs in TDLNs creates a local microenvironment that is potently suppressive of host antitumor T cell responses.


Figures

Figure 1
Figure 1
Expression of IDO in human and murine TDLNs. (A) Sentinel (first draining) LN from patients with breast carcinoma (left, ×100) and malignant melanoma (right, ×400), showing an abnormal infiltration of IDO+ cells (red chromogen). (B) Kaplan-Meier survival plot of 40 patients with malignant melanoma, stratified into those with an abnormal accumulation of IDO+ cells in the sentinel LN (+IDO), versus a normal (negative) pattern. (C) Expression of IDO in murine B16F10 melanoma. Left: Draining inguinal LN from a mouse with a B16F10 tumor, day 12, stained for IDO (red, ×100). Middle: Contralateral inguinal LN from the same animal as at left, stained for IDO (red, ×100). Right: High-power view of IDO+ cells shown in the left panel (×1,000). Controls for staining (anti-IDO antibody neutralized with the immunizing peptide) showed a negative pattern similar to that seen in the contralateral LN (not shown). (D) Draining and contralateral LNs from a mouse with B78H1–GM-CSF tumor, day 12, stained for IDO (red, both ×200).
Figure 2
Figure 2
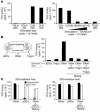
Suppression of T cell responses by TDLN cells. (A) Cells from TDLNs and contralateral LNs (CLN) were harvested from mice with B78H1–GM-CSF tumors (day 14), and used as stimulators in MLRs (stimulator cell number in parentheses; responder BM3 T cells at 5 × 10⁴ per well). Mixing experiments (right) demonstrated dominant suppression by the TDLN cells. (B) TDLN cells were sorted by four-color flow cytometry into pDCs (<1%), Treg’s (2–3%), and all other cells (95–97%), using the markers shown. Each fraction was used as stimulator cells in MLRs, adding the number of cells that would have been present in 5 × 10⁴ of the original TDLN population (thus, the pDCs were added at approximately 500 cells per well). All MLRs received 5 × 10⁴ BM3 responders. For mixing experiments, the sorted fractions were mixed in the same ratio in which they were present in the original unsorted preparation. (C) Suppression by pDCs is mediated by IDO. TDLN cells were sorted as described for B. The pDCs and “other” fraction were used as stimulators in MLRs (BM3 responders), with and without the IDO inhibitor 1MT. Left: TDLN cells taken from a wild-type (IDO-sufficient) host, showing suppression by pDCs, which was blocked by 1MT (arrows), and dominant suppression with mixing. Right: Tumors were grown in IDO-KO hosts, and the IDO-KO TDLN cells were harvested and assayed as at left. THY incorp., thymidine incorporation.
Figure 3
Figure 3
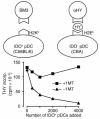
Dominant third-party suppression mediated by IDO+ pDCs. Two independent pairs of APCs and responder T cells were used to test the effect of IDO on third-party T cell responses. IDO+ pDCs from TDLNs presented H2Kb antigen to BM3 T cells, while IDO– DCs (sorted CD11c+ cells from normal CBA spleen) presented antigen to TCR-transgenic CD4+ T cells (recognizing a peptide from HY, restricted on H2Ek). In both cases, the APC/T cell ratio was 1:25. Graded numbers of the pDC+BM3 pair were added to 1 × 10⁵ cells of the DC+αHY pair, and the total proliferation was measured after 72 hours. The number of IDO+ pDCs added is shown on the x axis (with 4,000 cells reflecting a 1:1 ratio between the two pairs of MLRs). Duplicate sets of wells received either 1MT (squares) or no 1MT (triangles).
Figure 4
Figure 4
Adoptive transfer of DCs from TDLNs creates immunosuppression in new hosts. (A) Recruitment of BM3 T cells to draining LNs. CD11c+ DCs were purified from TDLNs and injected subcutaneously into CBA mice; recipients had previously received 4 × 10⁷ BM3 splenocytes intravenously (CBA+BM3 hosts). Control recipients received normal CD11c+ DCs from antigen-postive C57BL/6 mice without tumors (Normal antigen+ DCs); or normal DCs from antigen-negative CBA mice (Antigen– DCs). After 10 days, LNs draining the site of DC injection (left) and spleens (right) were harvested. BM3 cells were enumerated by FACS using anti-clonotypic antibody (expressed as a percentage of the total CD8+ T cells). Each bar represents four pooled nodes. (B) Functional unresponsiveness of T cells primed with DCs from TDLNs. CBA+BM3 mice were primed as described above, and LN cells were used as responders in recall MLRs (1 × 10⁵ responder cells with a titration of irradiated C57BL/6 splenocyte stimulators). (C) CBA+BM3 mice were primed for 10 days with DCs from TDLNs (left) or normal C57BL/6 LNs (right). Half of each group received 1MT (5 mg/d) via subcutaneous pellet as described in Methods, from the time of adoptive transfer until the end of the experiment; the other half received vehicle alone. Recall MLRs were performed as above. (D) Creation of unresponsiveness required functional IDO in the transferred DCs. Tumors were grown in IDO-KO mice, and TDLN DCs were isolated and used to prime CBA+BM3 mice, as in the preceding panels. Control recipients received TDLN DCs from wild-type hosts, or normal DCs from non–tumor-bearing mice. Just as above, normal DCs did not create unresponsiveness in recall MLRs, and IDO-sufficient TDLN DCs created complete unresponsiveness. The IDO-KO DCs, even though from TDLNs, did not create unresponsiveness; and responses were not further enhanced by addition of exogenous IL-2 to the recall MLR (last bar), which argues against any component of partial or cryptic anergy.
Figure 5
Figure 5
Antigen-specific anergy induced by adoptive transfer of TDLN DCs. (A) T cell unresponsiveness following adoptive transfer was not due to carry-over of IDO-mediated suppression, as shown by the lack of effect of 1MT when added to the recall MLRs. Priming of CBA+BM3 recipients was with TDLN DCs or normal C57BL/6 DCs, as in the previous figures. (B) Anergic BM3 cells are rescued by exogenous IL-2. CBA+BM3 recipients were primed with TDLN DCs, and BM3 T cells were sorted from draining LNs based on clonotypic TCR expression versus CD8. Recall MLRs were performed using these purified BM3 responders and irradiated C57BL/6 spleen cell stimulators, with or without the addition of mitogenic anti-CD3 antibody, recombinant IL-2, or PMA/ionomycin to the MLRs, as shown. (C) CBA+BM3 hosts were primed with TDLN DCs, and then anergic BM3 T cells (clonotype-positive, CD8+) were sorted and tested for responsiveness to irradiated C57BL/6 spleen cells, with or without anti-CD3 antibody. In contrast, the unfractionated host CD8+ population from the same LN showed good response to mitogen. (D) Response to third-party BALB/c antigens (irradiated BALB/c splenocytes, 5-day MLR) was intact in CBA+BM3 recipients primed with TDLN DCs, compared with normal CBA control mice.
Figure 6
Figure 6
IDO-mediated suppressor activity segregates with a CD19+ subset of pDCs. Cells from TDLNs were sorted into five populations based on expression of CD11c, B220, and CD19, as shown in the schematic at the top. The three CD11c+ DC fractions (groups I, II, and III) or B cells (group IV) were used as stimulators in MLRs (2 × 10⁵ BM3 responder cells with a titration of stimulator cells), with and without 1MT. Only the CD19+ pDCs (fraction I) showed significant IDO-mediated suppression.
Figure 7
Figure 7
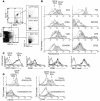
The CD19+ DC subset displays a phenotype consistent with pDCs. (A) Forward and side-scatter characteristics of B220+ DCs versus B220+ DCs, with the latter further gated into CD19+ and CD19– subsets. (B) TDLNs stained by four-color flow cytometry for CD11c versus CD19 versus the various markers shown. Overlay histograms show the CD19+ (filled trace) and CD19– subsets of CD11c+ cells. Isotype-matched controls (gated on CD11c+ cells) are shown in gray. Each histogram is representative of 4–12 experiments with each marker. (C) TDLN DCs were stained for markers of DC maturity, and analyzed as above. (D) Expression of cell-surface markers CD123 and CCR6 on the CD19+ and CD19– DC subsets. Cells were analyzed from TDLNs and from contralateral LNs of the same animals, as shown. The range for the isotype-matched negative control antibody (± 3 SD) is shown by the bars in each histogram.

Similar articles

Cited by

References

    1. Smyth MJ, Godfrey DI, Trapani JA. A fresh look at tumor immunosurveillance and immunotherapy. Nat. Immunol. 2001;2:293–299. - PubMed
    1. Staveley-O’Carroll K, et al. Induction of antigen-specific T cell anergy: an early event in the course of tumor progression. Proc. Natl. Acad. Sci. U. S. A. 1998;95:1178–1183. - PMC - PubMed
    1. Ochsenbein AF, et al. Roles of tumour localization, second signals and cross priming in cytotoxic T-cell induction. Nature. 2001;411:1058–1064. - PubMed
    1. Spiotto MT, et al. Increasing tumor antigen expression overcomes “ignorance” to solid tumors via crosspresentation by bone marrow-derived stromal cells. Immunity. 2002;17:737–747. - PubMed
    1. Wick M, et al. Antigenic cancer cells grow progressively in immune hosts without evidence for T cell exhaustion or systemic anergy. J. Exp. Med. 1997;186:229–238. - PMC - PubMed

Publication types

MeSH terms