

Controlled ultrasound tissue erosion
- PMID: 15244286
- PMCID: PMC2669757
- DOI: 10.1109/tuffc.2004.1308731
Controlled ultrasound tissue erosion
Abstract
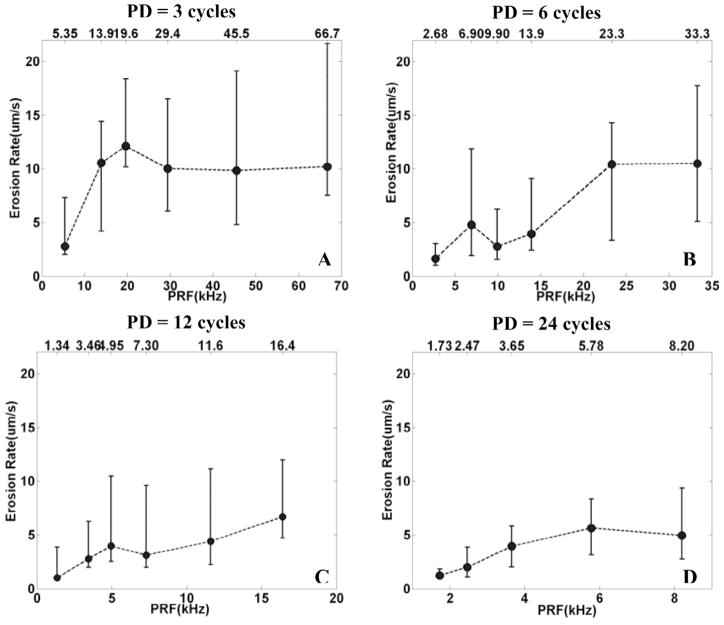
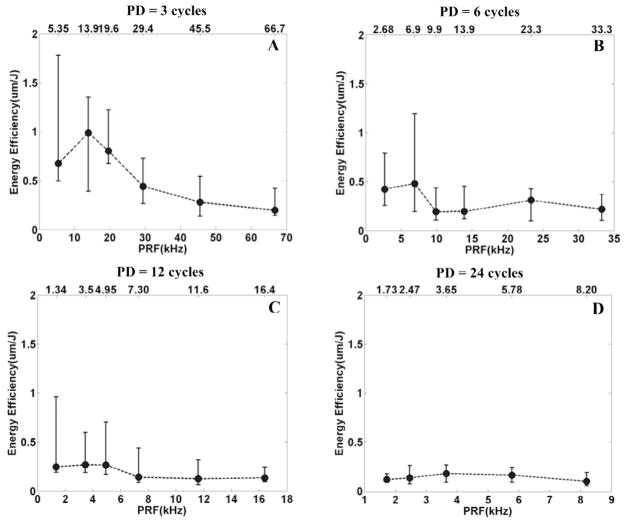
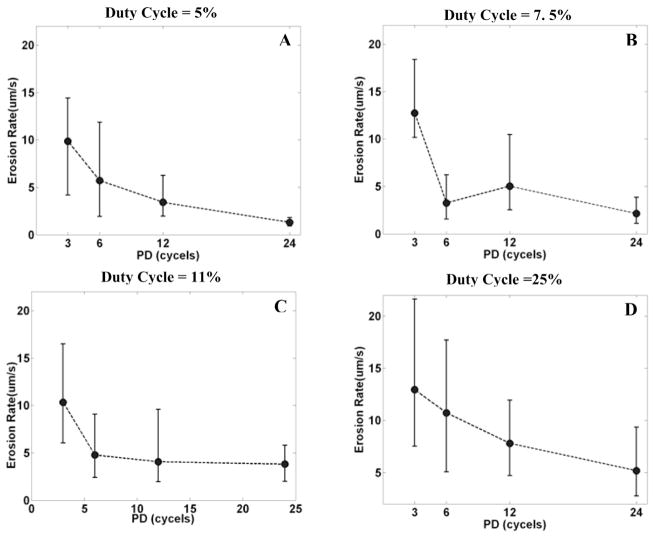
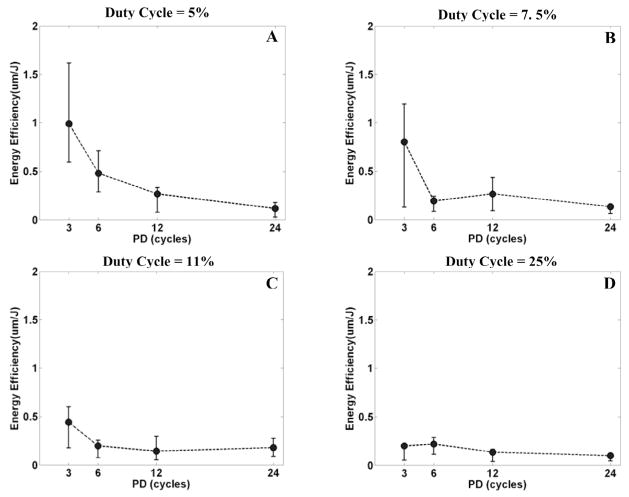
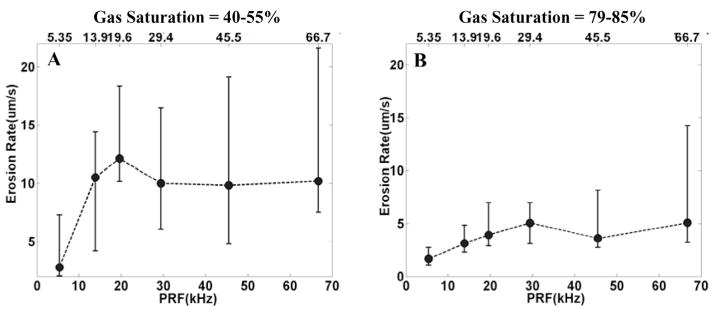
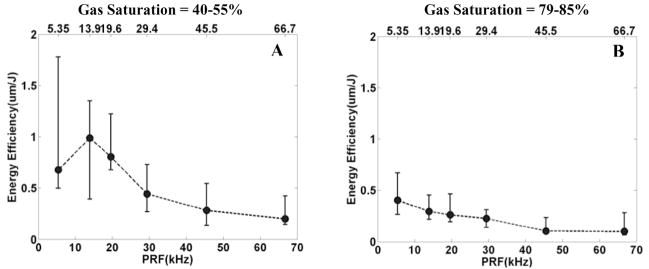
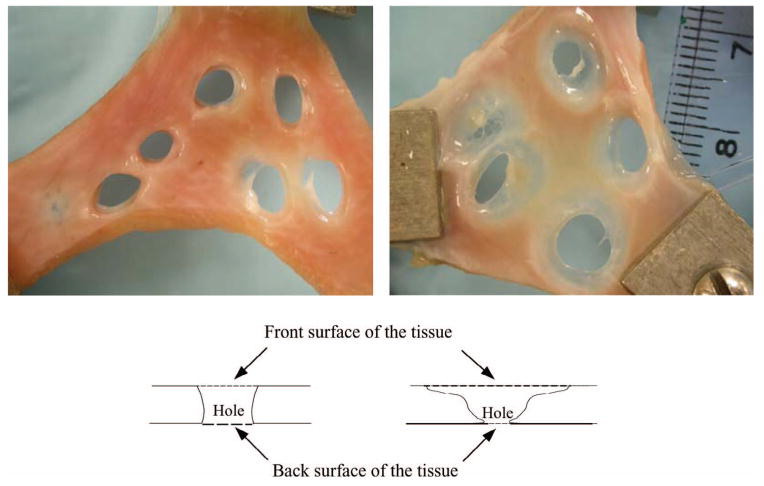
The ability of ultrasound to produce highly controlled tissue erosion was investigated. This study is motivated by the need to develop a noninvasive procedure to perforate the neonatal atrial septum as the first step in treatment of hypoplastic left heart syndrome. A total of 232 holes were generated in 40 pieces of excised porcine atrial wall by a 788 kHz single-element transducer. The effects of various parameters [e.g., pulse repetition frequency (PRF), pulse duration (PD), and gas content of liquid] on the erosion rate and energy efficiency were explored. An Isppa of 9000 W/cm2, PDs of 3, 6, 12, and 24 cycles; PRFs between 1.34 kHz and 66.7 kHz; and gas saturation of 40-55% and 79-85% were used. The results show that very short pulses delivered at certain PRFs could maximize the erosion rate and energy efficiency. We show that well-defined perforations can be precisely located in the atrial wall through the controlled ultrasound tissue erosion (CUTE) process. A preliminary in vivo experiment was conducted on a canine subject, and the atrial septum was perforated using CUTE.
Figures


Similar articles
-
Investigation of intensity thresholds for ultrasound tissue erosion.Ultrasound Med Biol. 2005 Dec;31(12):1673-82. doi: 10.1016/j.ultrasmedbio.2005.07.016. Ultrasound Med Biol. 2005. PMID: 16344129 Free PMC article.
-
A new strategy to enhance cavitational tissue erosion using a high-intensity, Initiating sequence.IEEE Trans Ultrason Ferroelectr Freq Control. 2006 Aug;53(8):1412-24. doi: 10.1109/tuffc.2006.1665098. IEEE Trans Ultrason Ferroelectr Freq Control. 2006. PMID: 16921893 Free PMC article.
-
Controlled ultrasound tissue erosion: the role of dynamic interaction between insonation and microbubble activity.J Acoust Soc Am. 2005 Jan;117(1):424-35. doi: 10.1121/1.1828551. J Acoust Soc Am. 2005. PMID: 15704435 Free PMC article.
-
Hypoplastic left heart syndrome with intact or highly restrictive atrial septum: outcome after neonatal transcatheter atrial septostomy.Circulation. 2004 May 18;109(19):2326-30. doi: 10.1161/01.CIR.0000128690.35860.C5. Epub 2004 May 10. Circulation. 2004. PMID: 15136496 Review.
-
Focused Ultrasound and Lithotripsy.Adv Exp Med Biol. 2016;880:113-29. doi: 10.1007/978-3-319-22536-4_7. Adv Exp Med Biol. 2016. PMID: 26486335 Review.
Cited by
-
An efficient treatment strategy for histotripsy by removing cavitation memory.Ultrasound Med Biol. 2012 May;38(5):753-66. doi: 10.1016/j.ultrasmedbio.2012.01.013. Epub 2012 Mar 6. Ultrasound Med Biol. 2012. PMID: 22402025 Free PMC article.
-
Coalescence of residual histotripsy cavitation nuclei using low-gain regions of the therapy beam during electronic focal steering.Phys Med Biol. 2018 Nov 12;63(22):225010. doi: 10.1088/1361-6560/aaeaf3. Phys Med Biol. 2018. PMID: 30418936 Free PMC article.
-
Active focal zone sharpening for high-precision treatment using histotripsy.IEEE Trans Ultrason Ferroelectr Freq Control. 2011 Feb;58(2):305-15. doi: 10.1109/TUFFC.2011.1808. IEEE Trans Ultrason Ferroelectr Freq Control. 2011. PMID: 21342816 Free PMC article.
-
Enhanced Shock Scattering Histotripsy With Pseudomonopolar Ultrasound Pulses.IEEE Trans Ultrason Ferroelectr Freq Control. 2019 Jul;66(7):1185-1197. doi: 10.1109/TUFFC.2019.2911289. Epub 2019 Apr 15. IEEE Trans Ultrason Ferroelectr Freq Control. 2019. PMID: 30990430 Free PMC article.
-
Neutrophil extracellular traps in tumor progression of gynecologic cancers.Front Immunol. 2024 Nov 1;15:1421889. doi: 10.3389/fimmu.2024.1421889. eCollection 2024. Front Immunol. 2024. PMID: 39555072 Free PMC article. Review.
References
-
- Henglein A, Gutierrez M. Chemical reactions by pulsed ultrasound: Memory effects in the formation of NO3- and NO2-in aerated water. Int J Radiat Biol Related Studies Phys Chem Med. 1986;50:527–533. - PubMed
-
- Child SZ, Hartman CL, Schery LA, Carstensen EL. Lung damage from exposure to pulsed ultrasound. Ultrasound Med Biol. 1990;16:817–825. - PubMed
-
- Frizzell LA, Chen E, Lee C. Effects of pulsed ultrasound on the mouse neonate: Hind limb paralysis and lung hemorrhage. Ultrasound Med Biol. 1994;20:53–63. - PubMed
-
- Dalecki D, Raeman CH, Child SZ, Carstensen EL. Intestinal hemorrhage from exposure to pulsed ultrasound. Ultrasound Med Biol. 1995;21:1067–1072. - PubMed
-
- El-Bialy TH, Royston TJ, Magin RL, Evans CA, Zaki Ael M, Frizzell LA. The effect of pulsed ultrasound on mandibular distraction. Ann Biomed Eng. 2002;30:1251–1261. - PubMed
Publication types
MeSH terms
Grants and funding
LinkOut - more resources
Full Text Sources
Other Literature Sources
Miscellaneous
