Circadian and light-induced transcription of clock gene Per1 depends on histone acetylation and deacetylation
- PMID: 15226430
- PMCID: PMC434252
- DOI: 10.1128/MCB.24.14.6278-6287.2004
Circadian and light-induced transcription of clock gene Per1 depends on histone acetylation and deacetylation
Abstract
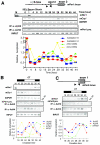
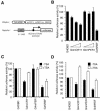
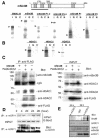
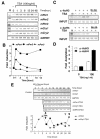
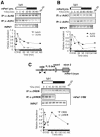
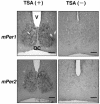
Circadian clock genes are regulated through a transcriptional-translational feedback loop. Alterations of the chromatin structure by histone acetyltransferases and histone deacetylases (HDACs) are commonly implicated in the regulation of gene transcription. However, little is known about the transcriptional regulation of mammalian clock genes by chromatin modification. Here, we show that the state of acetylated histones fluctuated in parallel with the rhythm of mouse Per1 (mPer1) or mPer2 expression in fibroblast cells and liver. Mouse CRY1 (mCRY1) repressed transcription with HDACs and mSin3B, which was relieved by the HDAC inhibitor trichostatin A (TSA). In turn, TSA induced endogenous mPer1 expression as well as the acetylation of histones H3 and H4, which interacted with the mPer1 promoter region in fibroblast cells. Moreover, a light pulse stimulated rapid histone acetylation associated with the promoters of mPer1 or mPer2 in the suprachiasmatic nucleus (SCN) and the binding of phospho-CREB in the CRE of mPer1. We also showed that TSA administration into the lateral ventricle induced mPer1 and mPer2 expression in the SCN. Taken together, these data indicate that the rhythmic transcription and light induction of clock genes are regulated by histone acetylation and deacetylation.
Figures
Similar articles
-
Rhythmic histone acetylation underlies transcription in the mammalian circadian clock.Nature. 2003 Jan 9;421(6919):177-82. doi: 10.1038/nature01314. Epub 2002 Dec 11. Nature. 2003. PMID: 12483227
-
Photic induction of mPer1 and mPer2 in cry-deficient mice lacking a biological clock.Science. 1999 Dec 24;286(5449):2531-4. doi: 10.1126/science.286.5449.2531. Science. 1999. PMID: 10617474
-
Disruption of mCry2 restores circadian rhythmicity in mPer2 mutant mice.Genes Dev. 2002 Oct 15;16(20):2633-8. doi: 10.1101/gad.233702. Genes Dev. 2002. PMID: 12381662 Free PMC article.
-
Synchronization of the molecular clockwork by light- and food-related cues in mammals.Biol Chem. 2003 May;384(5):711-9. doi: 10.1515/BC.2003.079. Biol Chem. 2003. PMID: 12817467 Review.
-
[Molecular mechanisms of biological clock: from molecular rhythms to physiological rhythms].No To Shinkei. 2003 Jan;55(1):5-11. No To Shinkei. 2003. PMID: 12649895 Review. Japanese. No abstract available.
Cited by
-
Palmitate impairs circadian transcriptomics in muscle cells through histone modification of enhancers.Life Sci Alliance. 2022 Oct 27;6(1):e202201598. doi: 10.26508/lsa.202201598. Print 2023 Jan. Life Sci Alliance. 2022. PMID: 36302651 Free PMC article.
-
Sleep, circadian rhythms, and interval timing: evolutionary strategies to time information.Front Integr Neurosci. 2012 Jan 4;5:92. doi: 10.3389/fnint.2011.00092. eCollection 2011. Front Integr Neurosci. 2012. PMID: 22319478 Free PMC article. No abstract available.
-
Circadian epigenomic remodeling and hepatic lipogenesis: lessons from HDAC3.Cold Spring Harb Symp Quant Biol. 2011;76:49-55. doi: 10.1101/sqb.2011.76.011494. Epub 2011 Sep 6. Cold Spring Harb Symp Quant Biol. 2011. PMID: 21900149 Free PMC article. Review.
-
Epigenetic control and the circadian clock: linking metabolism to neuronal responses.Neuroscience. 2014 Apr 4;264:76-87. doi: 10.1016/j.neuroscience.2014.01.043. Epub 2014 Jan 31. Neuroscience. 2014. PMID: 24486964 Free PMC article. Review.
-
Identification and functional analysis of early gene expression induced by circadian light-resetting in Drosophila.BMC Genomics. 2015 Aug 1;16(1):570. doi: 10.1186/s12864-015-1787-7. BMC Genomics. 2015. PMID: 26231660 Free PMC article.
References
-
- Akiyama, M., Y. Kouzu, S. Takahashi, H. Wakamatsu, T. Moriya, M. Maetani, S. Watanabe, H. Tei, Y. Sakaki, and S. Shibata. 1999. Inhibition of light- or glutamate-induced mPer1 expression represses the phase shifts into the mouse circadian locomotor and suprachiasmatic firing rhythms. J. Neurosci. 19:1115-1121. - PMC - PubMed
-
- Albrecht, U., Z. S. Sun, G. Eichele, and C. C. Lee. 1997. A differential response of two putative mammalian circadian regulators, mper1 and mper2, to light. Cell 91:1055-1064. - PubMed
-
- Albrecht, U., B. Zheng, D. Larkin, Z. S. Sun, and C. C. Lee. 2001. MPer1 and mper2 are essential for normal resetting of the circadian clock. J. Biol. Rhythms 16:100-104. - PubMed
-
- Balsalobre, A., F. Damiola, and U. Schibler. 1998. A serum shock induces circadian gene expression in mammalian tissue culture cells. Cell 93:929-937. - PubMed
Publication types
MeSH terms
Substances
LinkOut - more resources
Full Text Sources
Molecular Biology Databases
Research Materials
