. 2004 Jul;24(14):6172-83.
doi: 10.1128/MCB.24.14.6172-6183.2004.

Roles of Bim in apoptosis of normal and Bcr-Abl-expressing hematopoietic progenitors

Affiliations

Roles of Bim in apoptosis of normal and Bcr-Abl-expressing hematopoietic progenitors

Ryoko Kuribara et al. Mol Cell Biol. 2004 Jul.

Abstract

Bcr-Abl kinase is known to reverse apoptosis of cytokine-dependent cells due to cytokine deprivation, although it has been controversial whether chronic myeloid leukemia (CML) progenitors have the potential to survive under conditions in which there are limited amounts of cytokines. Here we demonstrate that early hematopoietic progenitors (Sca-1(+) c-Kit(+) Lin(-)) isolated from normal mice rapidly undergo apoptosis in the absence of cytokines. In these cells, the expression of Bim, a proapoptotic relative of Bcl-2 which plays a key role in the cytokine-mediated survival system, is induced. In contrast, those cells isolated from our previously established CML model mice resist apoptosis in cytokine-free medium without the induction of Bim expression, and these effects are reversed by the Abl-specific kinase inhibitor imatinib mesylate. In addition, the expression levels of Bim are uniformly low in cell lines established from patients in the blast crisis phase of CML, and imatinib induced Bim in these cells. Moreover, small interfering RNA that reduces the expression level of Bim effectively rescues CML cells from apoptosis caused by imatinib. These findings suggest that Bim plays an important role in the apoptosis of early hematopoietic progenitors and that Bcr-Abl supports cell survival in part through downregulation of this cell death activator.


Figures

FIG. 1.
FIG. 1.
Cytokine-dependent hematopoietic progenitors isolated from mouse bone marrow. (A) Cytospin preparation showing the morphology of Sca-1-positive early hematopoietic progenitors (Sca-1+ c-Kit+ Lin) isolated from primary cultures of mouse bone marrow cells visualized by May-Giemsa staining. (B and C) Cultures of Sca-1+ c-Kit+ Lin (left panels) and Sca-1 c-Kit+ Lin cells (right panels) were continued in the presence (B) or absence (C) of SCF and TPO. The numbers of viable cells were determined by trypan blue dye exclusion. Blast cells (black bars) and terminally differentiated cells (open bars) were quantified by cytospin centrifugation. Results from one representative study (B) and the means and standard errors of results from three independent experiments (C) are shown. (D) Sca-1+ c-Kit+ Lin cells were cultured in cytokine-free medium for the indicated periods. Cells were harvested, the TUNEL assay was performed with fluorescein-dUTP, and cells were stained with propidium iodide. Cytospin preparations were made and analyzed with a laser cytoscan.
FIG. 2.
FIG. 2.
Expression of Bcl-2, Bcl-xL, and BimEL in Sca-1+ c-Kit+ Lin and Sca-1 c-Kit+ Lin cells from normal mice. Cells were cultured in the absence of cytokines for the indicated times. (A) Real-time quantitative PCR was carried out, and the numbers of cycles required to produce a detectable product were measured and used to calculate differences (n-fold) in starting mRNA levels for each sample by using 28S rRNA as an internal control. mRNA expression levels in cells cultured for 0 (black bars), 3 (gray bars), and 6 (open bars) h without cytokines relative to those in cells cultured in the presence of cytokines are shown. (B) Protein expression levels of the three Bcl-2 superfamily members, as well as β-actin as a control for equal loading, were analyzed by immunoblotting with specific antibodies for each protein.
FIG. 3.
FIG. 3.
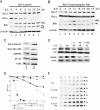
Bim expression is regulated by IL-3 or Bcr-Abl through Raf/MAPK and/or PI3-K pathways in Baf-3 cells. EL, BimEL; L, BimL; S, BimS. (A and B) Expression of Bcl-2, Bcl-xL, and Bim proteins in wild-type Baf-3 cells (A) and Baf-3 cells expressing Bcr-Abl after infection with a retrovirus vector (B). Cells were cultured in the absence of IL-3 for the indicated times. An immunoblot analysis using antibody specific for each protein was performed. A bracket in panel A indicates the phosphorylated forms of BimEL. (C) Phosphorylation of BimEL protein. Parental Baf-3 cells were cultured in the presence of IL-3 (lane 1) or in the absence of IL-3 (lane 2) for 4 h; IL-3-starved and Bcr-Abl expressing Baf-3, KOPM30, BV173, and K562 cells were cultured in the absence (lane 1) or presence (lane 2) of imatinib for 12 h. (D to F) Baf-3 cells expressing Bcr-Abl were cultured in IL-3-free medium for 72 h and then treated with PD, LY, or both (LY+PD) at a concentration of 50 μM for the indicated times (in hours). Immunoblot analyses using anti-phosphorylated form-specific Akt or MAPK, as well as antibodies recognizing total Akt or MAPK (D) or anti-Bim antibody (F), were performed. (E) Cell viability was determined by trypan blue dye exclusion. The survival curve of parental Baf-3 cells is shown as a control. Standard errors are shown when they were greater than 3%.
FIG. 4.
FIG. 4.
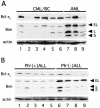
Levels of Bcl-xL and Bim protein in human leukemia cell lines. Immunoblot analysis using antibody specific for each protein was performed. EL, BimEL; L, BimL; S, BimS. (A) Lanes 1 to 6, the KOPM28, KOPM30, KOPM53, K562, BV173, and KU812 cell lines, respectively, established with CML/BC cells; lanes 7 to 9, the HL60 myeloid leukemia, HEL erythroid leukemia, and U937 monocytic leukemia cell lines, respectively, lacking Ph1. (B) Lanes 1 to 5, the KOPN-55bi, KOPN-57bi, KOPN-66bi, KOPN-72bi, and KOPN-30bi Ph1-positive pro-B ALL cell lines, respectively; lanes 6 to 9, the 920, 697, RS4;11, and UOC-B1 pro-B ALL cell lines, respectively, lacking Ph1.
FIG. 5.
FIG. 5.
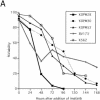
Effects of imatinib on cell lines established with CML/BC cells. (A) Cell lines (KOPM28, KOPM30, KOPM53, BV173, and K562) established with cells from CML/BC patients were cultured in medium containing imatinib at a concentration of 1 μM for the indicated times. Viability was determined by trypan blue dye exclusion. (B) Immunoblot analyses of K562 cell lysate using anti-phosphorylated form-specific Akt or MAPK, as well as antibodies recognizing total Akt or MAPK, were performed. (C) Levels of Bcl-xL and Bim proteins in KOPM30, BV173, and K562 cells were determined by immunoblot analysis. EL, BimEL; L, BimL; S, BimS. (D) K562 cells transfected with either Bim siRNA (Bim) or control siRNA (Cnt) were cultured in the presence of 1 μM imatinib for 48 h. The results of real-time RT-PCR using the Bim(si) primers (left panel) and an immunoblot analysis using antibodies specific for Bim (upper right panel) or Bcl-xL (lower right panel) are shown. Numbers below the immunoblots indicate the relative intensity of each band measured by densitometry. (E) K562 cells were cultured in the absence of imatinib (upper left panel), the presence of 1 μM imatinib for 48 h with mock transfection (upper right panel), Cy3-labeled control siRNA (lower left panel), or Cy3-labeled Bim siRNA (lower right panel). Cells were stained with annexin V-FITC and analyzed by flow cytometry.
FIG. 5.
FIG. 5.
Effects of imatinib on cell lines established with CML/BC cells. (A) Cell lines (KOPM28, KOPM30, KOPM53, BV173, and K562) established with cells from CML/BC patients were cultured in medium containing imatinib at a concentration of 1 μM for the indicated times. Viability was determined by trypan blue dye exclusion. (B) Immunoblot analyses of K562 cell lysate using anti-phosphorylated form-specific Akt or MAPK, as well as antibodies recognizing total Akt or MAPK, were performed. (C) Levels of Bcl-xL and Bim proteins in KOPM30, BV173, and K562 cells were determined by immunoblot analysis. EL, BimEL; L, BimL; S, BimS. (D) K562 cells transfected with either Bim siRNA (Bim) or control siRNA (Cnt) were cultured in the presence of 1 μM imatinib for 48 h. The results of real-time RT-PCR using the Bim(si) primers (left panel) and an immunoblot analysis using antibodies specific for Bim (upper right panel) or Bcl-xL (lower right panel) are shown. Numbers below the immunoblots indicate the relative intensity of each band measured by densitometry. (E) K562 cells were cultured in the absence of imatinib (upper left panel), the presence of 1 μM imatinib for 48 h with mock transfection (upper right panel), Cy3-labeled control siRNA (lower left panel), or Cy3-labeled Bim siRNA (lower right panel). Cells were stained with annexin V-FITC and analyzed by flow cytometry.
FIG. 6.
FIG. 6.
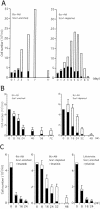
(A and B) Sca-1+ c-Kit+ Lin cells (left panel) and Sca-1 c-Kit+ Lin cells (right panel) amplified and isolated by primary cultures of bone marrow cells from Bcr-Abl tg mice were cultured in the presence (A) or absence (B) of SCF and TPO. (C) Sca-1+ c-Kit+ Lin cells (left and right panels) or Sca-1 c-Kit+ Lin cells (middle panel) amplified and isolated by primary cultures of bone marrow cells from Bcr-Abl tg mice (left and middle panels) or their normal littermates (right panel) were cultured in the absence of SCF and TPO. Imatinib was added at a concentration of 1 μM. The number of viable cells was determined by trypan blue dye exclusion. Blast cells (black bars) and terminally differentiated cells (open bars) were determined by cytospin centrifugation. The results from one representative study (A) or the means + standard errors of results from three independent experiments (B and C) are shown.
FIG. 7.
FIG. 7.
Expression of Bcl-2, Bcl-xL, and BimEL in Sca-1+ c-Kit+ Lin and Sca-1 c-Kit+ Lin cells from Bcr-Abl tg mice and their normal littermates. Cells were cultured in cytokine-free medium in the absence (A and B) or presence (C) of imatinib at a concentration of 1 μM for the indicated times. (A and C) Real-time quantitative PCR was carried out, and the numbers of cycles required to produce a detectable product were measured and used to calculate the differences (n-fold) in starting mRNA levels for each sample by using 28S rRNA as an internal control. Levels of mRNA in cells cultured for 0 (black bars), 3 (gray bars), and 6 (open bars) h without cytokines relative to those in cells in the presence of cytokines are shown. (B) Levels of three Bcl-2 superfamily members, as well as β-actin proteins, as a control for equal loading were detected by specific antibodies.

Similar articles

Cited by

References

    1. Adams, J. M., and S. Cory. 1998. The Bcl-2 protein family: arbiters of cell survival. Science 281:1322-1326. - PubMed
    1. Akiyama, T., P. Bouillet, T. Miyazaki, Y. Kadono, H. Chikuda, U. I. Chung, A. Fukuda, A. Hikita, H. Seto, T. Okada, T. Inaba, A. Sanjay, R. Baron, H. Kawaguchi, H. Oda, K. Nakamura, A. Strasser, and S. Tanaka. 2003. Regulation of osteoclast apoptosis by ubiquitylation of proapoptotic BH3-only Bcl-2 family member Bim. EMBO J. 22:6653-6664. - PMC - PubMed
    1. Amos, T. A., J. L. Lewis, F. H. Grand, R. P. Gooding, J. M. Goldman, and M. Y. Gordon. 1995. Apoptosis in chronic myeloid leukaemia: normal responses by progenitor cells to growth factor deprivation, X-irradiation and glucocorticoids. Br. J. Haematol. 91:387-393. - PubMed
    1. Bedi, A., B. A. Zehnbauer, J. P. Barber, S. J. Sharkis, and R. J. Jones. 1994. Inhibition of apoptosis by BCR-ABL in chronic myeloid leukemia. Blood 83:2038-2044. - PubMed
    1. Biswas, S. C., and L. A. Greene. 2002. Nerve growth factor (NGF) down-regulates the Bcl-2 homology 3 (BH3) domain-only protein Bim and suppresses its proapoptotic activity by phosphorylation. J. Biol. Chem. 277:49511-49516. - PubMed

Publication types

MeSH terms