. 2004 Jun 23;24(25):5670-83.
doi: 10.1523/JNEUROSCI.0330-04.2004.

Olfactory horizontal basal cells demonstrate a conserved multipotent progenitor phenotype

Affiliations

Olfactory horizontal basal cells demonstrate a conserved multipotent progenitor phenotype

Lindsay A Carter et al. J Neurosci. .

Abstract

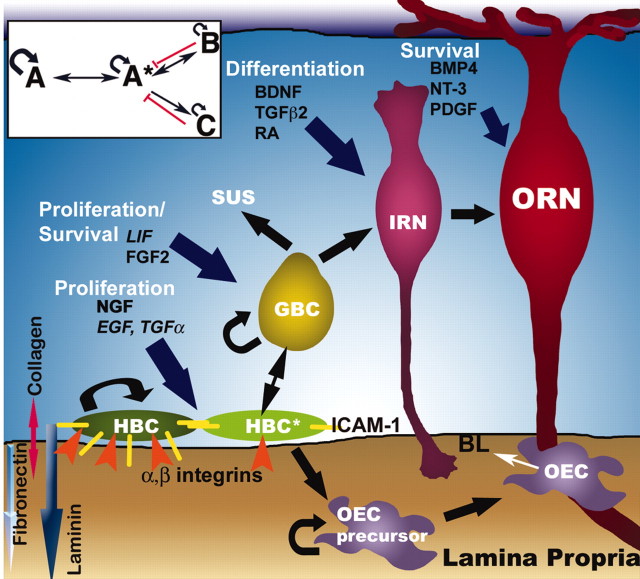
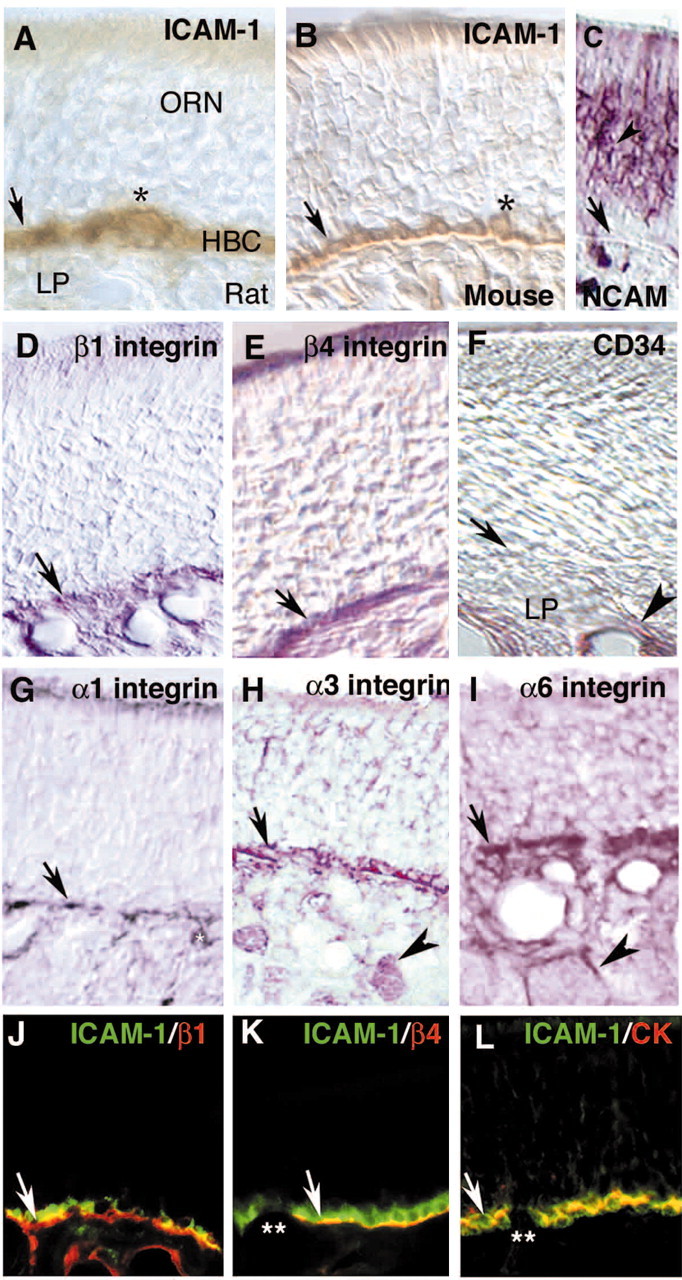
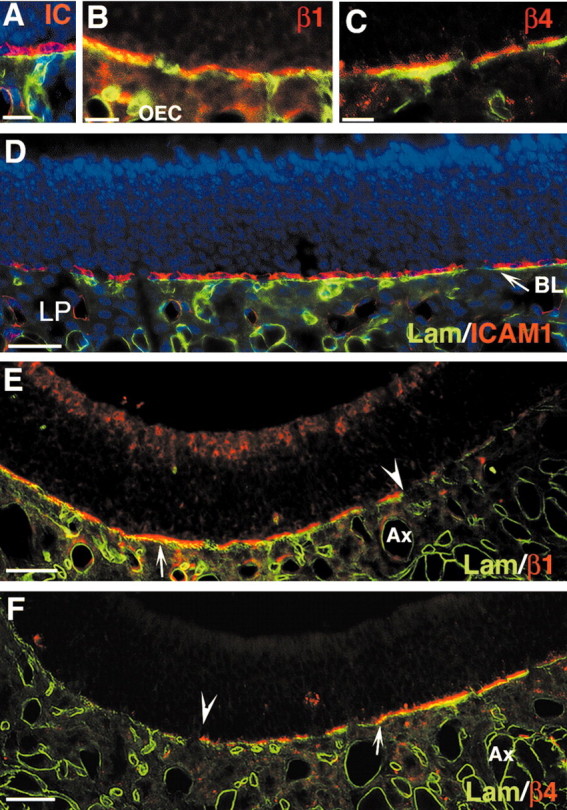
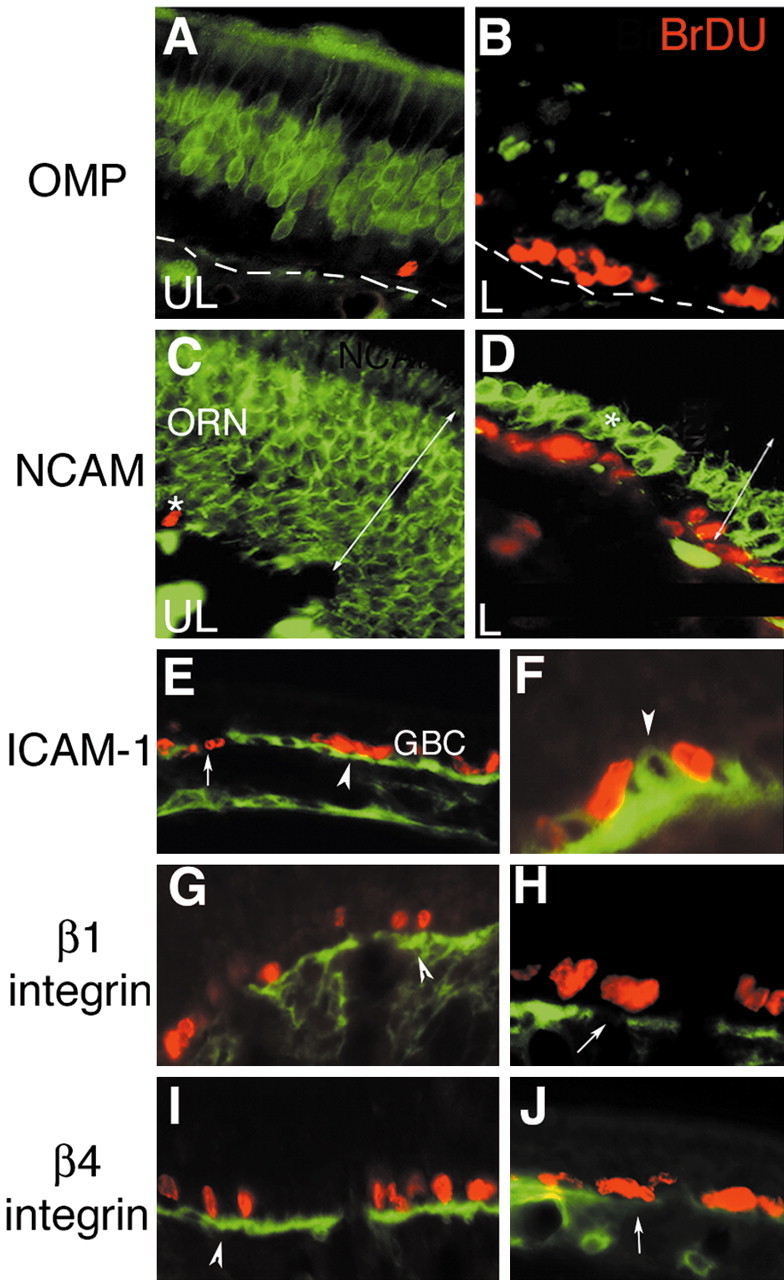
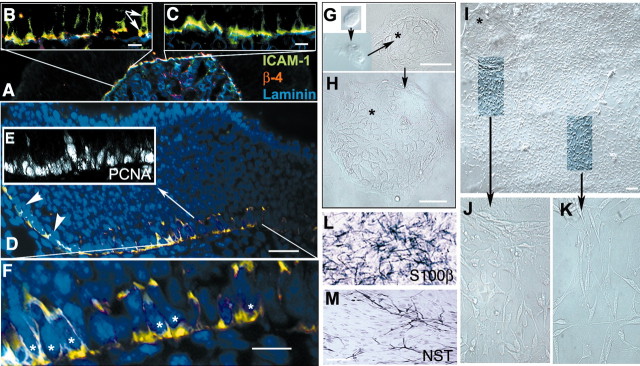
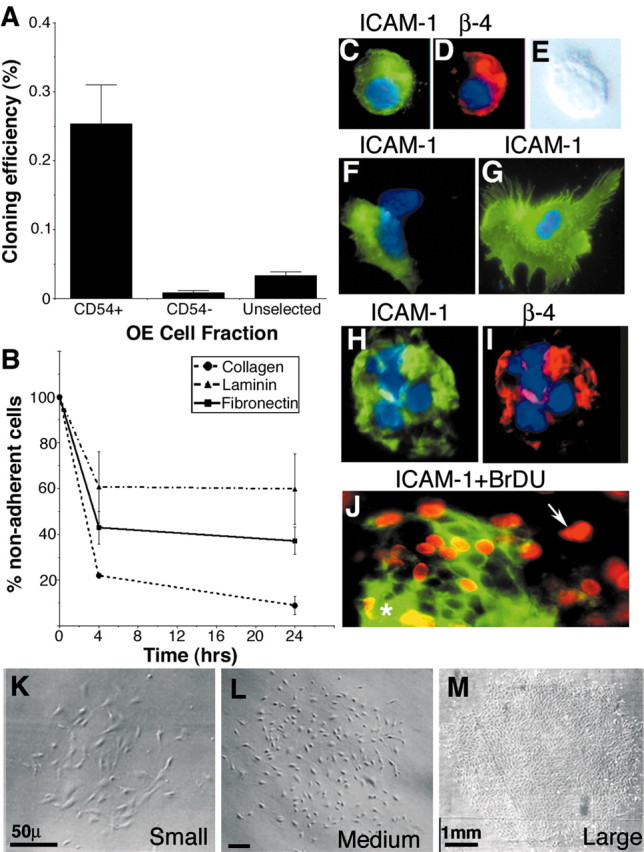
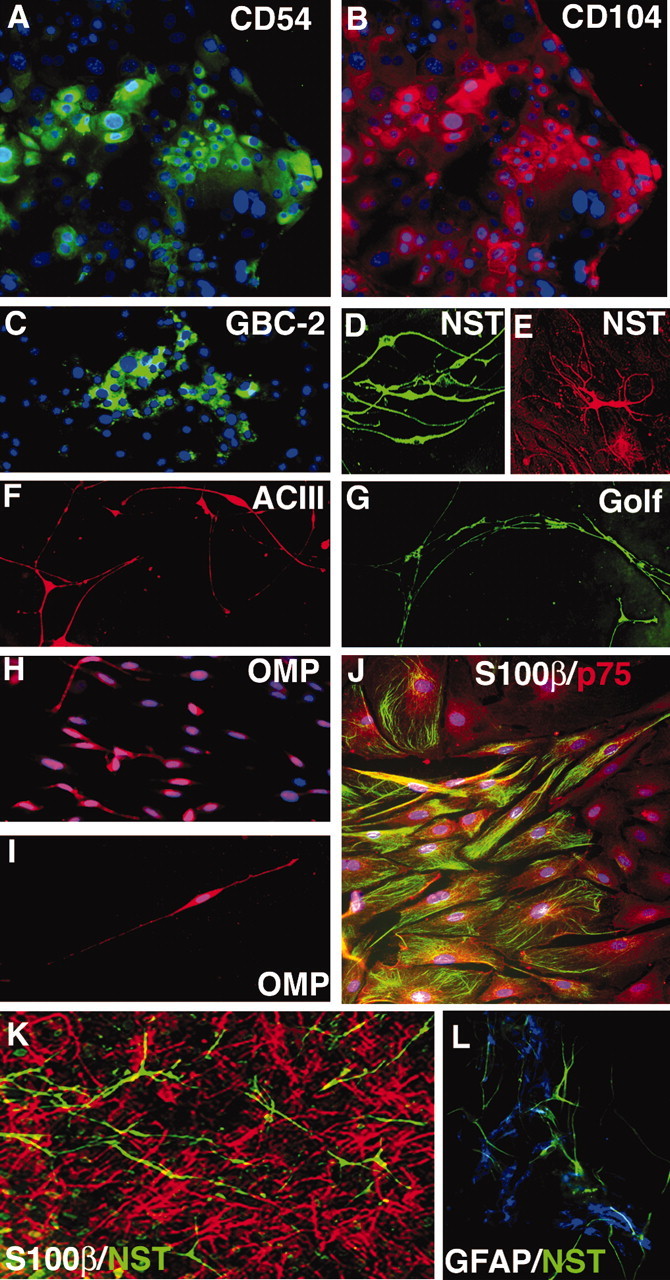
Stem cells of adult regenerative organs share a common goal but few established conserved mechanisms. Within the neural stem cell niche of the mouse olfactory epithelium, we identified a combination of extracellular matrix (ECM) receptors that regulate adhesion and mitosis in non-neural stem cells [intercellular adhesion molecule-1 (ICAM-1), beta1, beta4, and alpha-1, -3, and -6 integrins] and on horizontal basal cells (HBCs), candidate olfactory neuro-epithelial progenitors. Using ECM receptors as our guide, we recreated a defined microenvironment in vitro that mimics olfactory basal lamina and, when supplemented with epidermal growth factor, transforming growth factor alpha, and leukemia inhibitory factor, allows us to preferentially expand multiple clonal adherent colony phenotypes from individual ICAM-1+ and ICAM-1+/beta1 integrin+-selected HBCs. The most highly mitotic colony-forming HBCs demonstrate multipotency, spontaneously generating more ICAM-positive presumptive HBCs, a combination of olfactory neuroglial progenitors, and neurons of olfactory and potentially nonolfactory phenotypes. HBCs thus possess a conserved adhesion receptor expression profile similar to non-neural stem cells, preferential self-replication in an in vitro environment mimicking their in vivo niche, and contain subpopulations of cells that can produce multiple differentiated neuronal and glial progeny from within and beyond the olfactory system in vitro.


Figures

Figure 9.
Figure 9.
Factors that regulate the interaction of progenitor subtypes in the olfactory epithelium. HBCs can self renew (size of curved arrow indicates capacity to divide-self-renew) and exist in a tightly adherent and loosely adherent (HBC*) mitotic phenotypes, which are differentiated by their expression levels of ICAM-1 (yellow) and α and β integrin complexes (orange arrows). A more restricted neuronal-sustentacular (SUS) progenitor is found in the GBC population, whereas a gliogenic precursor can also be derived from mitotic HBCs. ECM gradients for laminin, collagen, and fibronectin are indicated, along with the factors that combine with matrix stimulation to positively regulate the balance between progenitor subtypes and immature and mature cells within the OE and lamina propria. Inset simplifies the relationship between different OE progenitor subtypes, where B (GBC) and C (OEC-GRPs) reside in entirely different ECM, cell-cell, and growth factor environments within the OE and lamina propria.
Figure 1.
Figure 1.
Basal cell mitosis after bulbectomy drives neurogenesis in the OE. A, After bulbectomy, cells in the basal cell layer take up BrDU during neurogenesis, predominantly on the side ipsilateral to the lesion (6d Lesioned). Three different points within turbinates (1-3; arrowheads) were assessed for the number of BrDU+ basal cells and show that maximal basal cell BrDU uptake (B) occurs at 6 d after bulbectomy in the lesioned OE when compared with the unlesioned side of the OE (n = 4). A significant (*p < 0.01) mitotic response is also seen on the side contralateral to the lesion (BrDU+ UL) by 10 d postbulbectomy when compared with unlesioned mice, with the majority of contralateral BrDU+ basal cells located along the septum(Sep) (position 2). C, The basal cell mitotic index is inversely proportional to the number of neurons directly overlying the basal cell layer. D, Basal cell mitosis is chiefly seen in the globose basal cell layer (two cell layers above basal lamina; dotted line) beginning at 2 d postbulbectomy in evenly spaced GBCs. Basal cell BrDU uptake expands from 2 to 14 d broadly within the GBC layer to also include rarely dividing flattened horizontal basal cells (arrow) on the basal lamina at the peak of neurogenesis (6 d postbulbectomy).
Figure 2.
Figure 2.
Adhesion receptor expression in horizontal basal cells. A, B, The ICAM-1 is exclusively expressed (arrow) in the HBC population of rat (A) and mouse (B) but not in the globose basal cell layer (*) or ORNs, using DAB immunohistochemistry. In the OE proper (above the basal lamina), the NCAM (C; VIP immunohistochemistry) is restricted to the neuronal population (ORN) and is excluded from basal cells (arrow points to HBC layer in all images). D-F, β1 Integrin (D) and β4 integrins (E) are also expressed chiefly by HBCs that (F) do not express the stem cell marker CD34 (arrow), which is found only on blood vessels in the lamina propria (LP; arrowhead). HBCs (arrows) also express α1 integrin (G) on their basal surface where they adhere to the basal lamina α3 integrin (H), which is also found in some mesaxon bundles (arrowhead), and α6 integrin (I), which is also expressed by periaxonal olfactory ensheathing cells (arrow-head) of the lamina propria. J-L, By double immunofluorescence, basal cell ICAM-1 expression (green) coincides on the HBC basal membrane (becoming yellow) with β1 integrin (J, red),β4 integrin (K, red), and also cytokeratin 903 (CK; L, red). Eruptions in the basal membrane caused by glandular ducts are indicated (**).
Figure 3.
Figure 3.
β1 and β4 integrins adhere HBCs to specific zones of olfactory epithelium basallamina. A, D, HBCs expressing ICAM-1 (A, red) on their lateral and basal surface sit directly on a laminin-rich (green) basallamina and are, at lower power (D), evenly distributed across the basallamina (BL) of the OE. In contrast, β1 integrin (B, red) is expressed only on the basal membrane of HBCs in direct contact with the laminin-rich (green) basal lamina (areas of direct contact are yellow), which is secreted by OECs of the lamina propria (LP). E, HBCs with high β1-integrin expression (red) define specific zones of the OE, which are flanked by stretches of HBCs that are mostly β1 negative. Boundary between these zones is marked with white arrowhead, under which are located the laminin-rich OEC ensheathments of ORN axon bundles (Ax). C, Similarly, HBCs localize β4 integrin (red) to their basal membrane where they are tightly bound to the basal lamina (green) and, at lower power, are distributed in high-expressing and low-expressing zones (F, separated by arrowhead) along the laminin-rich (green) basal lamina. Scale bars: A-C,10 μm; D-F,50 μm.
Figure 4.
Figure 4.
Loss of the mature ORN population stimulates basal cells to lose adhesion receptor expression as they undergo mitosis. The unlesioned (UL) OE contains a robust population of OMP+ ORNs (A, green), NCAM+ neurons (C), and rare, dividing, BrDU+ globose basal cells (red). Double-headed arrows indicate the thickness of the OE. The basallamina is indicated with a dotted line. B, The OE at 4 d after bulbectomy (L) has a vastly reduced sporadic OMP+ population (green) and exhibits robust BrDU uptake (red) in the basal cell layer. C, In unlesioned OE, NCAM (green) is expressed in immature and mature ORNs but excluded (*) from a zone of cells around dividing (red) basal cells. D, After bulbectomy, this layer immediately above the BrDU+ (red) basal cells becomes an NCAM+ immature receptor neuron population (green). E, Where GBCs become BrDU+ (red), adjacent HBCs (arrowhead) strongly express ICAM-1 (green). Where flattened nuclei of HBCs become BrDU+ (red, arrow) and prepare to leave the basal lamina, ICAM-1 expression is lost. F, At higher power, loss of lateral ICAM-1 expression by BrDU+ HBCs is more evident, whereas ICAM-1 expression is increased in neighboring BrDU-negative HBCs (green, arrowhead). G, Similarly, where cells of the globose basal cell layer are BrDU+ (red), adjacent HBCs on the basal lamina clearly express β1 integrin (G, green, arrowhead), and flattened HBCs lose β1 expression as they take up BrDU and prepare to leave the basal lamina (H). I, J, β4 integrin expression (I, green, arrowhead) is similarly upregulated on the basal surface of HBCs adjacent to BrDU+ GBCs adherent to the basal lamina and is lost as these cells take up BrDU, become mitotic (J, red, arrow) and leave the basal lamina.
Figure 5.
Figure 5.
Cells from the ICAM-1-rich fraction of OE form highly adhesive clonal colonies and produce differentiated neurons and glia in vitro. A, At P5, the HBC layer contains ICAM-1 (green)/β4 integrin (red)-rich cells on a laminin-rich (blue) basal lamina. B, ICAM-1 HBCs are dividing in a direction perpendicular to the basal lamina (double arrow), where one daughter contains β4 integrin (red) and the other does not. C, Some regions contain HBC with ICAM-1 and β4 expression primarily restricted to the basal surface. D-F, The ICAM-1+ (green)/cytokeratin+ (red) is a small percentage of the total population (DAPI; blue) but represents the majority of PCNA/Ki67-positive cells (E) that are clearly undergoing mitosis (* on HBC of origin) in a plane perpendicular to the basal lamina (F). An ICAM-1+-rich/NCAM-negative cell fraction prepared from the neonatal mouse OE was subsequently dissociated into single cells and plated at clonal density on a collagen matrix in DMEM/F12 with 10% fetal calf serum. G, Single cells (* marks the same cell position followed over time in vitro) of this cell fraction expanded rapidly over 7 DIV to form small, tightly adhesive colonies. H, Colony expansion continued from 7 to 14 DIV to produce colonies containing 25-40,000 cells (medium-large colony shown here). C, At 14-28 DIV, the larger colonies (colony marked with* in top left-hand corner) produced multiple differentiated progeny (I-K) (bipolar and multipolar), which usually migrated away from the edge the colony. J begins at the edge of the original colony boundary. In some instances, differentiated progeny arose from the center of the colony and migrated along the more adhesive colonies beneath. L, M, Cells of both glial (L) (S100β+) and neuronal (M) (type III β neuron-specific tubulin (TuJ1+) phenotypes were represented in migratory cells. Scale bars: B, C, F, 10 μm; G-M, 50 μm.
Figure 6.
Figure 6.
Single-cell selection for ICAM-1 yields a population of horizontal basal cells capable of surviving and expanding at clonal density. ICAM-1+ cells (CD54+) were selected by MACS and plated at clonal density to assay for colony forming ability. A, More than 90% of the colony-forming cells from the OE were found in the CD54+ fraction. B, An adherence assay revealed that the ICAM-1+ cells preferentially adhered to a collagen matrix, over fibronectin or laminin, within 4 hr of plating. Statistical significance (n = 3) was calculated by a Student's t test; *p < 0.0005. After plating selected CD54+ cells on a collagen matrix, single cells were positive for ICAM-1 (CD54; C, green) and β4 integrin (CD104; D, red; DAPI stains nuclei blue), where E is the bright-field image for both at 1 DIV. ICAM+ cells divide asymmetrically (F) and symmetrically (G) as they expand to first form small colonies that are frequently homogeneously positive for ICAM-1 (CD54; H, green) and β4 integrin (CD104; I, red). As the colonies expand, they become more heterogeneous, with some ICAM-1+ cells (green) concentrated at the core becoming BrDU+ in the interior of the colony (J, red; marked with*). Other BrDU+ cells on the periphery of the colony are negative for ICAM-1 expression (arrow). At 14 DIV, the colonies can be subdivided into three categories on the basis of size: small, <30 cells (K); medium, 30-150 cells (L); and large, >150 cells (M). Scale bars: K, L, 50 μm; M, 1 mm.
Figure 7.
Figure 7.
Optimizing cloning efficiency of ICAM-1-selected cells by substrate and growth factor selection. A, At clonal density, single ICAM-1+ cells adhered to a collagen (C) matrix, but overall cloning efficiency was significantly enhanced when collagen was mixed with laminin (L) in a 1:2 ratio. Overall cloning efficiency was diminished when fibronectin (Fn) was included as a substrate (n = 4). B, The relative percentage of large colonies increased on a collagen:laminin mixed substrate, whereas a laminin-rich environment promoted the growth of small colonies at the expense of large colonies (n = 4). C, Overall cloning efficiency of ICAM-1+ HBCs on collagen, tested in Opti-MEM/4% FCS, was significantly enhanced in the presence of EGF (10 ng/ml) and further enhanced when a mixture of EGF and TGFα (0.5 ng/ml) was used. D, Predominantly small colonies were generated from all ICAM-1+ cells grown in Opti-MEM with 4%FCS alone. However, the addition of EGF, LIF, and TGFα significantly increased the percentage of large colonies obtained primarily at the expense of small colonies. Statistical significance was calculated using a Student's t test (n = 4-6). *p < 0.05; **p < 0.01; *** p < 0.0005. E, For FACS, live cells were first gated by 7-AAD exclusion. F, G, They were then gated for ICAM-1 positivity (F) (R2; 12.3 ± 1.9% of live cells) or ICAM-1/β1 double positivity (R3; 6.2 ± 0.8% of live cells) before plating (G).
Figure 8.
Figure 8.
A single ICAM-1-selected horizontal basal cell can produce multiple differentiated neuronal and glial progeny. After the expansion of single ICAM-1+ cell into a colony on a laminin-collagen mixed substrate, ICAM-1 (CD54; A, green; DAPI nuclear stain) continues to be expressed in subpopulations of cells at the core of the adherent colony that also express (B4 integrin (CD104; red). Small islands of cells positive for the GBC-2 (green) were also found within some large colonies. Cells migrating up from the colony were found to express β-III NST (D) (TuJ1+) and have a bipolar morphology (green) and a multipolar morphology (E, red). Long bipolar cells, which formed streams of migrating cells leaving colonies and extending processes across the matrix, demonstrated robust process and cell body expression of the ACIII (F, red) and the Golf (G, green). H, The OMP (red) is expressed in the cell bodies (overlapping with DAPI to become purple) and some processes of cells with a bipolar morphology, which were found growing with other OMP-negative cells. I, Highest OMP expression levels were found in cells that had migrated into a substrate-rich, cell-poor region of the culture. Populations of cells resembling olfactory ensheathing cells (S100β, green; p75 red) were frequently found in clusters but infrequently alone. Large colonies also generated intermingling populations of spindly S100β+ glial cells (K, red), NST+ neurons (green), and flattened GFAP+ glial cells (L, blue) lying beneath networks of NST+ (green) neurons.

Similar articles

Cited by

References

    1. Adams JC, Watt FM (1990) Changes in keratinocyte adhesion during terminal differentiation: reduction in fibronectin binding precedes alpha 5 beta 1 integrin loss from the cell surface. Cell 63: 425-435. - PubMed
    1. Adams JC, Watt FM (1991) Expression of beta 1, beta 3, beta 4, and beta 5 integrins by human epidermal keratinocytes and non-differentiating keratinocytes. J Cell Biol 115: 829-841. - PMC - PubMed
    1. Aiba T, Mori J, Nakai Y (1993) Nerve growth factor (NGF) and its receptor in rat olfactory epithelium. Acta Otolaryngol Suppl (Stockh) 506: 37-40. - PubMed
    1. Arkin S, Naprstek B, Guarini L, Ferrone S, Lipton JM (1991) Expression of intercellular adhesion molecule-1 (CD54) on hematopoietic progenitors. Blood 77: 948-953. - PubMed
    1. Au E, Roskams AJ (2003) Olfactory ensheathing cells of the lamina propria in vivo and in vitro Glia 41: 224-236. - PubMed

Publication types

Substances