Mouse Huntington's disease homolog mRNA levels: variation and allele effects
- PMID: 15200234
- PMCID: PMC5991148
- DOI: 10.3727/000000003783992234
Mouse Huntington's disease homolog mRNA levels: variation and allele effects
Abstract
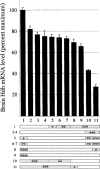
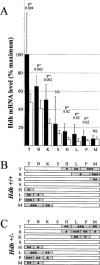
Huntington's disease homolog (Hdh) mRNA levels in mice with different Hdh alleles were measured. Brain Hdh mRNA levels varied up to threefold in genetically identical wild-type mice, indicating nongenetic factors influence Hdh expression. Striatal Hdh mRNA levels from an allele with a repeat expanded to 150 CAGs were diminished compared with wild-type and showed variation that might contribute to phenotypic variability in the Hdh(CAG)150 knock-in mouse model. To determine whether Hdh mRNA levels are tightly regulated, we assessed these levels in mice heterozygous for a deletion of the Hdh promoter. The loss of one allele reduced Hdh mRNA levels in most tissues, suggesting mechanisms to maintain Hdh mRNA levels are not in effect and should not impede therapies designed to destroy mutant huntingtin mRNA. Finally, we found a correlation between tissue mRNA levels and the susceptibility of the Hdh locus to Cre-mediated deletion. The two tissues with the highest levels of Hdh mRNA, testes and brain, were the only tissues susceptible to Cre-mediated recombination between loxP sites at Hdh locus. In contrast, the same Cre-expressing line caused recombination in every tissue for loxP sites at another genomic location. The pattern of Cre susceptibility at Hdh suggests a correlation between chromatin accessibility and high levels of Hdh expression in testes and brain.
Figures


Similar articles
-
Genetic background modifies nuclear mutant huntingtin accumulation and HD CAG repeat instability in Huntington's disease knock-in mice.Hum Mol Genet. 2006 Jun 15;15(12):2015-24. doi: 10.1093/hmg/ddl125. Epub 2006 May 10. Hum Mol Genet. 2006. PMID: 16687439
-
Lack of huntingtin promotes neural stem cells differentiation into glial cells while neurons expressing huntingtin with expanded polyglutamine tracts undergo cell death.Neurobiol Dis. 2013 Feb;50:160-70. doi: 10.1016/j.nbd.2012.10.015. Epub 2012 Oct 23. Neurobiol Dis. 2013. PMID: 23089356
-
HD CAG-correlated gene expression changes support a simple dominant gain of function.Hum Mol Genet. 2011 Jul 15;20(14):2846-60. doi: 10.1093/hmg/ddr195. Epub 2011 May 2. Hum Mol Genet. 2011. PMID: 21536587 Free PMC article.
-
Mutant huntingtin's effects on striatal gene expression in mice recapitulate changes observed in human Huntington's disease brain and do not differ with mutant huntingtin length or wild-type huntingtin dosage.Hum Mol Genet. 2007 Aug 1;16(15):1845-61. doi: 10.1093/hmg/ddm133. Epub 2007 May 21. Hum Mol Genet. 2007. PMID: 17519223
-
Loss of normal huntingtin function: new developments in Huntington's disease research.Trends Neurosci. 2001 Mar;24(3):182-8. doi: 10.1016/s0166-2236(00)01721-5. Trends Neurosci. 2001. PMID: 11182459 Review.
Cited by
-
Allele-specific conditional destabilization of glutamine repeat mRNAs.Gene Expr. 2005;12(3):213-22. doi: 10.3727/000000005783992089. Gene Expr. 2005. PMID: 16128004 Free PMC article.
-
Early white matter abnormalities, progressive brain pathology and motor deficits in a novel knock-in mouse model of Huntington's disease.Hum Mol Genet. 2015 May 1;24(9):2508-27. doi: 10.1093/hmg/ddv016. Epub 2015 Jan 21. Hum Mol Genet. 2015. PMID: 25609071 Free PMC article.
-
Mouse models of polyglutamine diseases: review and data table. Part I.Mol Neurobiol. 2012 Oct;46(2):393-429. doi: 10.1007/s12035-012-8315-4. Epub 2012 Sep 7. Mol Neurobiol. 2012. PMID: 22956270 Free PMC article. Review.
-
Early autophagic response in a novel knock-in model of Huntington disease.Hum Mol Genet. 2010 Oct 1;19(19):3702-20. doi: 10.1093/hmg/ddq285. Epub 2010 Jul 8. Hum Mol Genet. 2010. PMID: 20616151 Free PMC article.
-
Xpa deficiency reduces CAG trinucleotide repeat instability in neuronal tissues in a mouse model of SCA1.Hum Mol Genet. 2011 Dec 15;20(24):4822-30. doi: 10.1093/hmg/ddr421. Epub 2011 Sep 15. Hum Mol Genet. 2011. PMID: 21926083 Free PMC article.
References
-
- Ambrose C. M.; Duyao M. P.; Barnes G.; Bates G. P.; Lin C. S.; et al. Structure and expression of the Huntington’s disease gene: Evidence against simple in-activation due to an expanded CAG repeat. Somat. Cell Mol. Genet. 20:27–38; 1994. - PubMed
-
- Andrew S. E.; Goldberg Y. P.; Kremer B.; Telenius H.; Theilmann J.; et al. The relationship between trinucleotide (CAG) repeat length and clinical features of Huntington’s disease. Nat. Genet. 4:398–403; 1993. - PubMed
-
- Barnes G. T.; Duyao M. P.; Ambrose C. M.; McNeil S.; Persichetti F.; et al. Mouse Huntington’s disease gene homolog (Hdh). Somat. Cell Mol. Genet. 20:87–97; 1994. - PubMed
-
- Blake W.; Kaern M.; Cantor C.; Collins J. Noise in eukaryotic gene expression. Nature 422:633–637; 2003. - PubMed
Publication types
MeSH terms
Substances
Grants and funding
LinkOut - more resources
Full Text Sources
Medical
Molecular Biology Databases
