The roles of segmental and tandem gene duplication in the evolution of large gene families in Arabidopsis thaliana
- PMID: 15171794
- PMCID: PMC446195
- DOI: 10.1186/1471-2229-4-10
The roles of segmental and tandem gene duplication in the evolution of large gene families in Arabidopsis thaliana
Abstract
Background: Most genes in Arabidopsis thaliana are members of gene families. How do the members of gene families arise, and how are gene family copy numbers maintained? Some gene families may evolve primarily through tandem duplication and high rates of birth and death in clusters, and others through infrequent polyploidy or large-scale segmental duplications and subsequent losses.
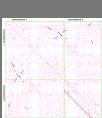
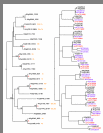
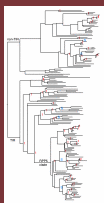
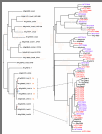
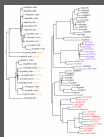
Results: Our approach to understanding the mechanisms of gene family evolution was to construct phylogenies for 50 large gene families in Arabidopsis thaliana, identify large internal segmental duplications in Arabidopsis, map gene duplications onto the segmental duplications, and use this information to identify which nodes in each phylogeny arose due to segmental or tandem duplication. Examples of six gene families exemplifying characteristic modes are described. Distributions of gene family sizes and patterns of duplication by genomic distance are also described in order to characterize patterns of local duplication and copy number for large gene families. Both gene family size and duplication by distance closely follow power-law distributions.
Conclusions: Combining information about genomic segmental duplications, gene family phylogenies, and gene positions provides a method to evaluate contributions of tandem duplication and segmental genome duplication in the generation and maintenance of gene families. These differences appear to correspond meaningfully to differences in functional roles of the members of the gene families.
Figures



Similar articles
-
OrthoParaMap: distinguishing orthologs from paralogs by integrating comparative genome data and gene phylogenies.BMC Bioinformatics. 2003 Sep 2;4:35. doi: 10.1186/1471-2105-4-35. Epub 2003 Sep 2. BMC Bioinformatics. 2003. PMID: 12952558 Free PMC article.
-
Patterns of gene duplication in the plant SKP1 gene family in angiosperms: evidence for multiple mechanisms of rapid gene birth.Plant J. 2007 Jun;50(5):873-85. doi: 10.1111/j.1365-313X.2007.03097.x. Epub 2007 Apr 23. Plant J. 2007. PMID: 17470057
-
Contrasting modes of diversification in the Aux/IAA and ARF gene families.Plant Physiol. 2004 Jul;135(3):1738-52. doi: 10.1104/pp.104.039669. Epub 2004 Jul 9. Plant Physiol. 2004. PMID: 15247399 Free PMC article.
-
Tandem and segmental gene duplication and recombination in the evolution of plant disease resistance gene.Trends Genet. 2004 Mar;20(3):116-22. doi: 10.1016/j.tig.2004.01.007. Trends Genet. 2004. PMID: 15049302 Review.
-
Genome duplication and gene-family evolution: the case of three OXPHOS gene families.Gene. 2008 Sep 15;421(1-2):1-6. doi: 10.1016/j.gene.2008.05.011. Epub 2008 Jun 23. Gene. 2008. PMID: 18573316 Review.
Cited by
-
Genome-wide identification of the expansin gene family in tobacco (Nicotiana tabacum).Mol Genet Genomics. 2016 Oct;291(5):1891-907. doi: 10.1007/s00438-016-1226-8. Epub 2016 Jun 21. Mol Genet Genomics. 2016. PMID: 27329217
-
Comprehensive Genome-Wide Analysis and Expression Pattern Profiling of PLATZ Gene Family Members in Solanum Lycopersicum L. under Multiple Abiotic Stresses.Plants (Basel). 2022 Nov 15;11(22):3112. doi: 10.3390/plants11223112. Plants (Basel). 2022. PMID: 36432841 Free PMC article.
-
The Analysis, Description, and Examination of the Maize LAC Gene Family's Reaction to Abiotic and Biotic Stress.Genes (Basel). 2024 Jun 6;15(6):749. doi: 10.3390/genes15060749. Genes (Basel). 2024. PMID: 38927685 Free PMC article.
-
Defining the RNA-binding glycine-rich (RBG) gene superfamily: new insights into nomenclature, phylogeny, and evolutionary trends obtained by genome-wide comparative analysis of Arabidopsis, Chinese cabbage, rice and maize genomes.Mol Genet Genomics. 2015 Dec;290(6):2279-95. doi: 10.1007/s00438-015-1080-0. Epub 2015 Jun 30. Mol Genet Genomics. 2015. PMID: 26123085
-
Genome-Wide Identification of PEBP Gene Family in Two Dendrobium Species and Expression Patterns in Dendrobium chrysotoxum.Int J Mol Sci. 2023 Dec 14;24(24):17463. doi: 10.3390/ijms242417463. Int J Mol Sci. 2023. PMID: 38139293 Free PMC article.
References
-
- Tichtinsky G, Vanoosthuyse V, Cock JM, Gaude T. Making inroads into plant receptor kinase signalling pathways. Trends Plant Sci. - PubMed
-
- Feldman KA. Cytochrome P450s as genes for crop improvement. Plant Biotech. 2001;4:162–167. - PubMed
-
- Nelson DR. Arabidopsis P450 statistics. http://drnelson.utmem.edu/Arabfam.html
Publication types
MeSH terms
Substances
LinkOut - more resources
Full Text Sources
Other Literature Sources
Molecular Biology Databases

