

Chromatin decondensation and nuclear reorganization of the HoxB locus upon induction of transcription
- PMID: 15155579
- PMCID: PMC415637
- DOI: 10.1101/gad.292104
Chromatin decondensation and nuclear reorganization of the HoxB locus upon induction of transcription
Abstract
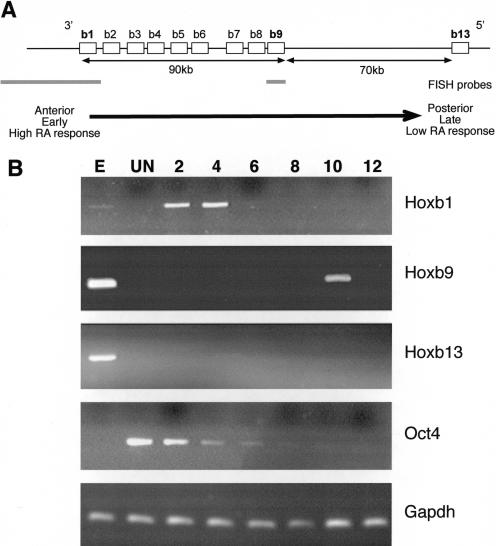
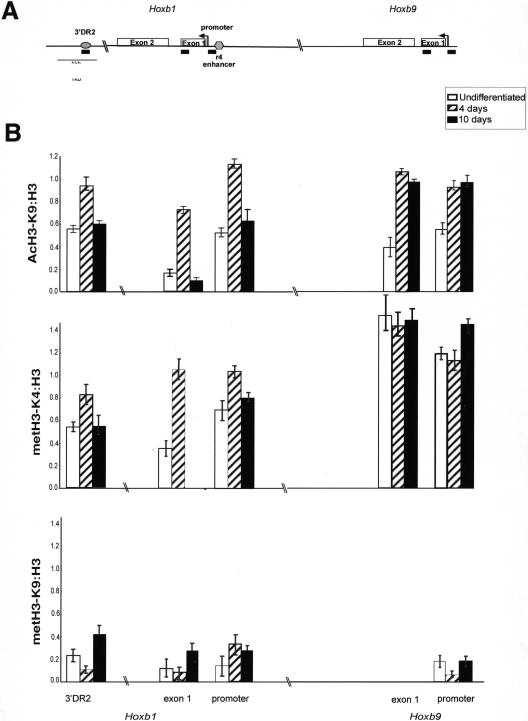
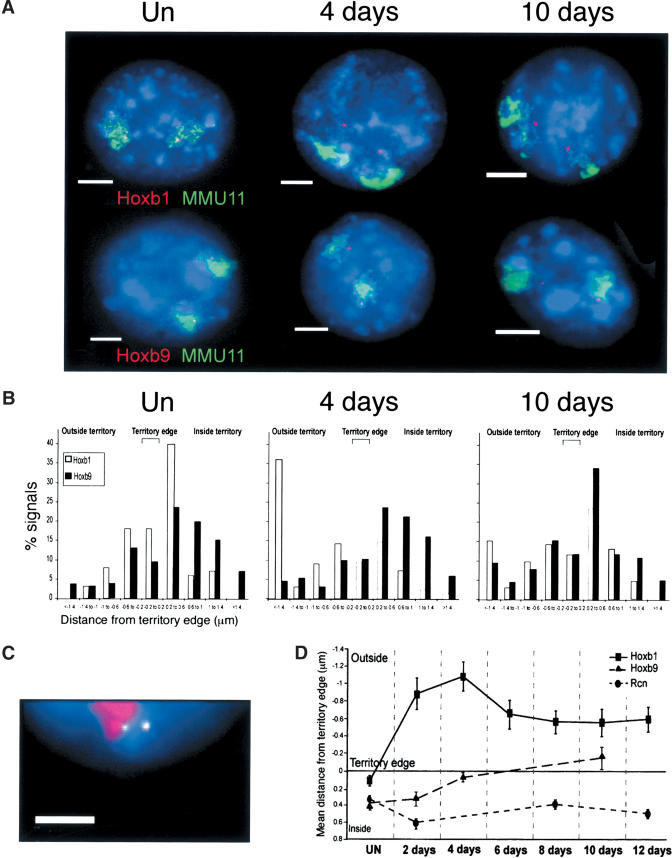
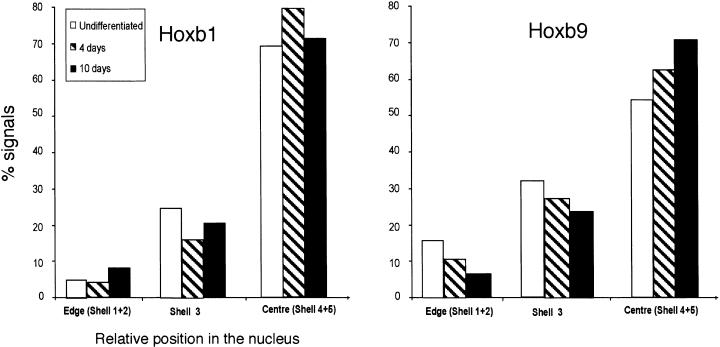
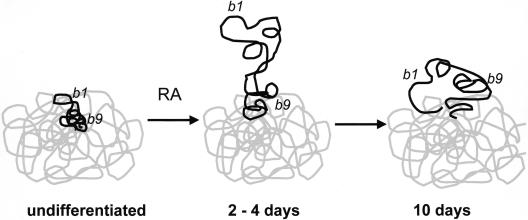
The colinearity of genes in Hox clusters suggests a role for chromosome structure in gene regulation. We reveal programmed changes in chromatin structure and nuclear organization upon induction of Hoxb expression by retinoic acid. There is an early increase in the histone modifications that are marks of active chromatin at both the early expressed gene Hoxb1, and also at Hoxb9 that is not expressed until much later. There is also a visible decondensation of the chromatin between Hoxb1 and Hoxb9 at this early stage. However, a further change in higher-order chromatin structure, looping out of genes from the chromosome territory, occurs in synchrony with the execution of the gene expression program. We suggest that higher-order chromatin structure regulates the expression of the HoxB cluster at several levels. Locus-wide changes in chromatin structure (histone modification and chromatin decondensation) may establish a transcriptionally poised state but are not sufficient for the temporal program of gene expression. The choreographed looping out of decondensed chromatin from chromosome territories may then allow for activation of high levels of transcription from the sequence of genes along the cluster.
Figures

Similar articles
-
Nuclear re-organisation of the Hoxb complex during mouse embryonic development.Development. 2005 May;132(9):2215-23. doi: 10.1242/dev.01813. Development. 2005. PMID: 15829525
-
Nuclear reorganisation and chromatin decondensation are conserved, but distinct, mechanisms linked to Hox gene activation.Development. 2007 Mar;134(5):909-19. doi: 10.1242/dev.02779. Epub 2007 Jan 24. Development. 2007. PMID: 17251268
-
HoxB domain induction silences DNA replication origins in the locus and specifies a single origin at its boundary.EMBO Rep. 2006 Aug;7(8):812-6. doi: 10.1038/sj.embor.7400758. Epub 2006 Jul 14. EMBO Rep. 2006. PMID: 16845368 Free PMC article.
-
Chromatin looping and the probability of transcription.Trends Genet. 2006 Apr;22(4):197-202. doi: 10.1016/j.tig.2006.02.004. Epub 2006 Feb 21. Trends Genet. 2006. PMID: 16494964 Review.
-
Gene activation and deactivation related changes in the three-dimensional structure of chromatin.Chromosoma. 2005 Nov;114(5):331-7. doi: 10.1007/s00412-005-0015-7. Epub 2005 Nov 12. Chromosoma. 2005. PMID: 16075283 Review.
Cited by
-
A Conserved Structural Signature of the Homeobox Coding DNA in HOX genes.Sci Rep. 2016 Oct 14;6:35415. doi: 10.1038/srep35415. Sci Rep. 2016. PMID: 27739488 Free PMC article.
-
Analysis of dynamic changes in retinoid-induced transcription and epigenetic profiles of murine Hox clusters in ES cells.Genome Res. 2015 Aug;25(8):1229-43. doi: 10.1101/gr.184978.114. Epub 2015 May 29. Genome Res. 2015. PMID: 26025802 Free PMC article.
-
Single-wall and multi-wall carbon nanotubes promote rice root growth by eliciting the similar molecular pathways and epigenetic regulation.IET Nanobiotechnol. 2016 Aug;10(4):222-9. doi: 10.1049/iet-nbt.2015.0046. IET Nanobiotechnol. 2016. PMID: 27463793 Free PMC article.
-
"Self-regulation," a new facet of Hox genes' function.Dev Dyn. 2014 Jan;243(1):182-91. doi: 10.1002/dvdy.24019. Epub 2013 Sep 2. Dev Dyn. 2014. PMID: 23913823 Free PMC article.
-
Chromatin accessibility at the HIV LTR promoter sets a threshold for NF-κB mediated viral gene expression.Integr Biol (Camb). 2012 Jun;4(6):661-71. doi: 10.1039/c2ib20009k. Epub 2012 May 3. Integr Biol (Camb). 2012. PMID: 22555315 Free PMC article.
References
-
- Billon N., Jolicoeur, C., Ying, Q.L., Smith, A., and Raff, M. 2002. Normal timing of oligodendrocyte development from genetically engineered, lineage-selectable mouse ES cells. J. Cell. Sci. 115: 3657–3665. - PubMed
-
- Brown D.G., Warren, V.N., Pahlsson, P., and Kimber, S.J. 1993. Carbohydrate antigen expression in murine embryonic stem cells and embryos, I: Lacto and neo-lacto determinants. Histochem. J. 25: 452–463. - PubMed
-
- Carruthers L.M. and Hansen, J.C. 2000. The core histone N termini function independently of linker histones during chromatin condensation. J. Biol. Chem. 275: 37285–37290. - PubMed
Publication types
MeSH terms
Substances
LinkOut - more resources
Full Text Sources
Other Literature Sources