. 2004 Jun;78(11):5957-65.
doi: 10.1128/JVI.78.11.5957-5965.2004.

Cleavage between replicase proteins p28 and p65 of mouse hepatitis virus is not required for virus replication

Affiliations

Cleavage between replicase proteins p28 and p65 of mouse hepatitis virus is not required for virus replication

Mark R Denison et al. J Virol. 2004 Jun.

Abstract

The p28 and p65 proteins of mouse hepatitis virus (MHV) are the most amino-terminal protein domains of the replicase polyprotein. Cleavage between p28 and p65 has been shown to occur in vitro at cleavage site 1 (CS1), (247)Gly downward arrow Val(248), in the polyprotein. Although critical residues for CS1 cleavage have been mapped in vitro, the requirements for cleavage have not been studied in infected cells. To define the determinants of CS1 cleavage and the role of processing at this site during MHV replication, mutations and deletions were engineered in the replicase polyprotein at CS1. Mutations predicted to allow cleavage at CS1 yielded viable virus that grew to wild-type MHV titers and showed normal expression and processing of p28 and p65. Mutant viruses containing predicted noncleaving mutations or a CS1 deletion were also viable but demonstrated delayed growth kinetics, reduced peak titers, decreased RNA synthesis, and small plaques compared to wild-type controls. No p28 or p65 was detected in cells infected with predicted noncleaving CS1 mutants or the CS1 deletion mutant; however, a new protein of 93 kDa was detected. All introduced mutations and the deletion were retained during repeated virus passages in culture, and no phenotypic reversion was observed. The results of this study demonstrate that cleavage between p28 and p65 at CS1 is not required for MHV replication. However, proteolytic separation of p28 from p65 is necessary for optimal RNA synthesis and virus growth, suggesting important roles for these proteins in the formation or function of viral replication complexes.


Figures

FIG. 1.
FIG. 1.
A59 genome organization and replicase antibodies. The A59 genome is 32 kb long. The replicase gene (gene 1, 22 kb) is shown, with replicase protein domains in overlapping ORF1a and ORF1b. Hatched boxes indicate proteinases: PLP1 domain (papain-like proteinase 1), PLP2 domain (papain-like proteinase 2), and 3CLpro (3C-like proteinase). The protein domains for mature proteins p28, p65, p210, p22, Pol, and Hel are indicated. Arrows beneath proteins indicate cleavage by the relevant proteinases. The first cleavage site between p28 and p65 (CS1) is shown. Black rectangles beneath the schematic indicate proteins generated to induce the rabbit polyclonal antibodies used in this study.
FIG. 2.
FIG. 2.
Mutagenesis of CS1. (Top) Organization and relative sizes of cDNA fragments A to G used for assembly of full-length MHV cDNA. (Middle) Expansion of genome fragment A showing coding domains for p28, p65, and the N-terminal 33% of p210, with the PLP1 domain intact. The amino acid (aa) and nucleotide termini of fragment A are indicated. (Bottom) P5 through P5′ of CS1 indicated by position and nucleotide and amino acid sequences, with amino acid numbering for P1 and P1′. The vertical arrow shows the site of cleavage. Nucleotide and amino acid mutations are shown for each mutant, and the deletion is indicated by the caret. Cleavage in vitro is based on previously published studies (10, 14), and virus viability is based on data from this study. N/T, not tested in vitro.
FIG. 3.
FIG. 3.
Plaque morphology and sequences of CS1 mutants. (A) Plaque morphology of CS1 mutants. All images were obtained at the same resolution (magnification, 10×) with a Zeiss Axiovert microscope. Black circles were visually drawn at limits of plaques. Percentages represent total plaque areas of black circles, with A59 arbitrarily set at 100%. icwt is assembled wild-type strain A59; the other viruses are mutants as in Fig. 2. (B) Sequence data from RT-PCR of virion RNA showing retained mutations following passage of cloned wild-type and mutant viruses in culture as described in the text. The location of CS1 is indicated by RGV and a vertical dotted line. Mutations are indicated by horizontal bars with dots at mutated nucleotides and the resulting amino acid change underneath the bar. Δ indicates a nucleotide deleted in mutΔCS1.
FIG. 4.
FIG. 4.
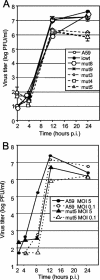
Growth of CS1 mutant viruses in DBT cells. (A) Growth of CS1 mutants at an MOI of 0.1 PFU/cell. A59, icwt, and mutant viruses mut8, mut9, mut3, mut4, and mut5 were used to infect DBT cells at an MOI of 0.1 PFU/ml. Following 30 min of attachment, cells were rinsed three times and incubated in medium. Samples were obtained at the postinfection (p.i.) times indicated, and titers were determined by plaque assay on DBT cells at 37°C. Error bars indicate standard deviations of plaque assay replicates. (B) Comparison of growth at low and high MOIs. A59 and mut5 viruses were used to infect DBT cells at MOIs of 5 and 0.1 PFU/ml. Virus growth assay was performed as described for panel A, with samples taken at the postinfection times indicated and titers determined by plaque assay. The values shown are averages of duplicate plaque assays.
FIG. 5.
FIG. 5.
Processing of p28 and p65 in CS1 mutants. (A) Pulse-labeling of replicase proteins p28 and p65. DBT cells were infected for 6 h and labeled with [35S]Met-Cys for 60 min, and lysates of infected cells were immunoprecipitated with UP102, followed by electrophoresis in sodium dodecyl sulfate-5 to 18% polyacrylamide gels. Molecular mass (kilodaltons) markers are to the left of the gel; A59, icwt, and mutant viruses are indicated above the lanes; and masses of specific proteins (in kilodaltons) are shown to the right of the gel, with p28 and p65 also indicated by filled circles. The novel 93- and 70-kDa products are indicated by arrows. (B) Pulse-chase labeling. The experiment was performed the same way as the pulse-labeling experiment, except that following the 60-min labeling period (indicated by the number 60 above lanes), the radiolabel was removed and cells were incubated in medium with excess unlabeled Met-Cys for an additional 90-min chase (c90). Viruses, markers, and proteins are the same as in panel A.
FIG. 6.
FIG. 6.
Growth and protein expression of CS1 deletion mutant mutΔCS1. (A) Viral growth. Following infection at an MOI of 0.1 PFU/cell, virus growth was determined by plaque assay as described in the legend to Fig. 4 for the viruses indicated in the inset. mutΔ indicates mutΔCS1 throughout the figure. p.i., postinfection. (B) Protein expression. DBT cells were infected for 6 h and labeled with [35S]Met-Cys for 60 min, and lysates of infected cells were immunoprecipitated with UP102, followed by electrophoresis on sodium dodecyl sulfate-5 to 18% polyacrylamide gels. Molecular mass markers are to the left of the gel, and specific products are to the right (masses are in kilodaltons). Viruses are indicated above the lanes. mutΔ indicates mutΔCS1. *mutΔ is the same gel lane as mutΔ but exposed to film four times as long as the other lanes. (C) Lysates from panel B immunoprecipitated with α-p22 antiserum. A marker protein is shown to the left, and the location of p22 is shown to the right of the gel.
FIG. 7.
FIG. 7.
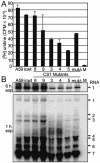
RNA synthesis in CS1 mutants. (A) Metabolic labeling of viral RNA. DBT cells were mock infected (M) or infected with A59, icwt, or the indicated CS1 mutants. At 4.5 hpi, actinomycin D was added to a final concentration of 20 μg/ml. Cells were radiolabeled with [3H]uridine from 5 to 7 hpi and lysed, and TCA-precipitated viral RNA was quantitated by liquid scintillation counting. Error bars represent standard deviations of duplicate measurements. mutΔ indicates mutΔCS1 throughout the figure. (B) Northern blot analysis. DBT cells were mock infected or infected with A59, icwt, or the indicated CS1 mutants in parallel with the infections shown in panel A. Cells were lysed in Trizol at 10 hpi, and RNA from approximately 4 × 10⁵ cells was separated on a 0.8% agarose-formaldehyde gel. RNA was transferred to a nylon membrane, UV cross-linked, and probed with a 32P-labeled negative-polarity primer complementary to the 3′ UTR to detect positive-strand RNA species. Top, 6-h exposure of genomic RNA (RNA 1); bottom, 1-h exposure of all positive-strand RNA species. Genomic RNA and sgRNA species are indicated by number to the right.

Similar articles

Cited by

References

    1. Baker, S. C., C.-K. Shieh, L. H. Soe, M.-F. Chang, D. M. Vannier, and M. M. C. Lai. 1989. Identification of a domain required for autoproteolytic cleavage of murine coronavirus gene A polyprotein. J. Virol. 63:3693-3699. - PMC - PubMed
    1. Bonilla, P. J., S. A. Hughes, J. D. Pinon, and S. R. Weiss. 1995. Characterization of the leader papain-like proteinase of MHV-A59: identification of a new in vitro cleavage site. Virology 209:489-497. - PubMed
    1. Bonilla, P. J., S. A. Hughes, and S. R. Weiss. 1997. Characterization of a second cleavage site and demonstration of activity in trans by the papain-like proteinase of the murine coronavirus mouse hepatitis virus strain A59. J. Virol. 71:900-909. - PMC - PubMed
    1. Brockway, S. M., C. T. Clay, X. T. Lu, and M. R. Denison. 2003. Characterization of the expression, intracellular localization, and replication complex association of the putative mouse hepatitis virus RNA-dependent RNA polymerase. J. Virol. 77:10515-10527. - PMC - PubMed
    1. Chen, W., and R. S. Baric. 1996. Molecular anatomy of mouse hepatitis virus persistence: coevolution of increased host cell resistance and virus virulence. J. Virol. 70:3947-3960. - PMC - PubMed

Publication types

MeSH terms

LinkOut - more resources