

Sockeye: a 3D environment for comparative genomics
- PMID: 15123592
- PMCID: PMC479126
- DOI: 10.1101/gr.1890304
Sockeye: a 3D environment for comparative genomics
Abstract
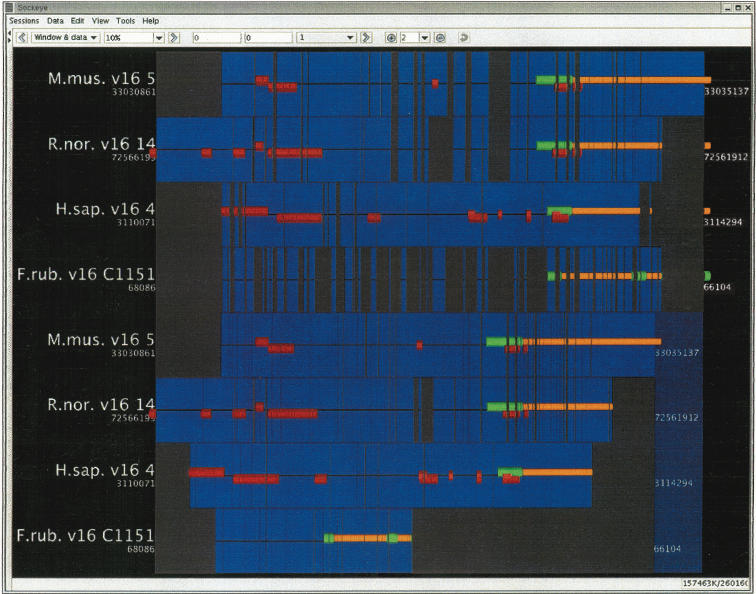
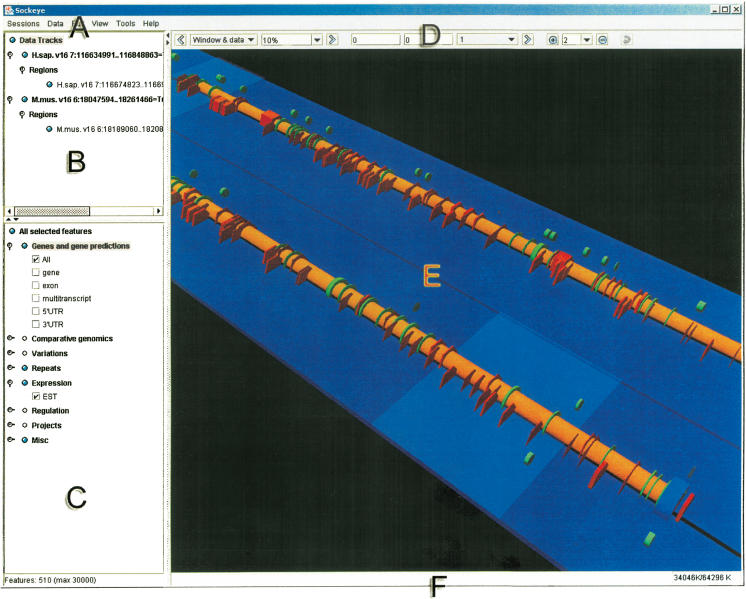
Comparative genomics techniques are used in bioinformatics analyses to identify the structural and functional properties of DNA sequences. As the amount of available sequence data steadily increases, the ability to perform large-scale comparative analyses has become increasingly relevant. In addition, the growing complexity of genomic feature annotation means that new approaches to genomic visualization need to be explored. We have developed a Java-based application called Sockeye that uses three-dimensional (3D) graphics technology to facilitate the visualization of annotation and conservation across multiple sequences. This software uses the Ensembl database project to import sequence and annotation information from several eukaryotic species. A user can additionally import their own custom sequence and annotation data. Individual annotation objects are displayed in Sockeye by using custom 3D models. Ensembl-derived and imported sequences can be analyzed by using a suite of multiple and pair-wise alignment algorithms. The results of these comparative analyses are also displayed in the 3D environment of Sockeye. By using the Java3D API to visualize genomic data in a 3D environment, we are able to compactly display cross-sequence comparisons. This provides the user with a novel platform for visualizing and comparing genomic feature organization.
Figures


Similar articles
-
Statistical Viewer: a tool to upload and integrate linkage and association data as plots displayed within the Ensembl genome browser.BMC Bioinformatics. 2005 Apr 12;6:95. doi: 10.1186/1471-2105-6-95. BMC Bioinformatics. 2005. PMID: 15826305 Free PMC article.
-
GeneViTo: visualizing gene-product functional and structural features in genomic datasets.BMC Bioinformatics. 2003 Oct 31;4:53. doi: 10.1186/1471-2105-4-53. BMC Bioinformatics. 2003. PMID: 14594459 Free PMC article.
-
GATA: a graphic alignment tool for comparative sequence analysis.BMC Bioinformatics. 2005 Jan 17;6:9. doi: 10.1186/1471-2105-6-9. BMC Bioinformatics. 2005. PMID: 15655071 Free PMC article.
-
An Experimental Approach to Genome Annotation: This report is based on a colloquium sponsored by the American Academy of Microbiology held July 19-20, 2004, in Washington, DC.Washington (DC): American Society for Microbiology; 2004. Washington (DC): American Society for Microbiology; 2004. PMID: 33001599 Free Books & Documents. Review.
-
GAIA: framework annotation of genomic sequence.Genome Res. 1998 Mar;8(3):234-50. doi: 10.1101/gr.8.3.234. Genome Res. 1998. PMID: 9521927 Review.
Cited by
-
Genomorama: genome visualization and analysis.BMC Bioinformatics. 2007 Jun 14;8:204. doi: 10.1186/1471-2105-8-204. BMC Bioinformatics. 2007. PMID: 17570856 Free PMC article.
-
MetaLook: a 3D visualisation software for marine ecological genomics.BMC Bioinformatics. 2007 Oct 22;8:406. doi: 10.1186/1471-2105-8-406. BMC Bioinformatics. 2007. PMID: 17953757 Free PMC article.
-
The Ensembl core software libraries.Genome Res. 2004 May;14(5):929-33. doi: 10.1101/gr.1857204. Genome Res. 2004. PMID: 15123588 Free PMC article. Review.
-
iMotifs: an integrated sequence motif visualization and analysis environment.Bioinformatics. 2010 Mar 15;26(6):843-4. doi: 10.1093/bioinformatics/btq026. Epub 2010 Jan 26. Bioinformatics. 2010. PMID: 20106815 Free PMC article.
-
FixingTIM: interactive exploration of sequence and structural data to identify functional mutations in protein families.BMC Proc. 2014 Aug 28;8(Suppl 2 Proceedings of the 3rd Annual Symposium on Biologica):S3. doi: 10.1186/1753-6561-8-S2-S3. eCollection 2014. BMC Proc. 2014. PMID: 25237390 Free PMC article.
References
-
- Altschul, S.F., Gish, W., Miller, W., Myers, E.W., and Lipman, D.J. 1990. Basic local alignment search tool. J. Mol. Biol. 215: 403-410. - PubMed
-
- Ashburner, M. and Drysdale, R. 1994. FlyBase: The Drosophila genetic database. Development 120: 2077-2079. - PubMed
-
- Bohannon, J. 2002. Bioinformatics: The human genome in 3D, at your fingertips. Science 298: 737. - PubMed
WEB SITE REFERENCES
-
- http://www.bcgsc.bc.ca/sockeye; CMSGSC's Sockeye page.
-
- http://www.bcgsc.bc.ca/sockeye/gr2004_online_supplement; Sockeye version 1.0 User's Guide.
-
- http://www.bcgsc.ca/bioinfo/SARS/; CMSGSC SARS.
-
- db01.bcgsc.bc.ca; Ensembl data mirror.
-
- ensemb01.bcgsc.bc.ca:8082; Ensembl Web mirror.
Publication types
MeSH terms
LinkOut - more resources
Full Text Sources
Research Materials