. 2004 May;24(10):4593-604.
doi: 10.1128/MCB.24.10.4593-4604.2004.

Acquisition of Hrs, an essential component of phagosomal maturation, is impaired by mycobacteria

Affiliations

Acquisition of Hrs, an essential component of phagosomal maturation, is impaired by mycobacteria

Otilia V Vieira et al. Mol Cell Biol. 2004 May.

Abstract

Pathogenic mycobacteria survive within macrophages by precluding the fusion of phagosomes with late endosomes or lysosomes. Because the molecular determinants of normal phagolysosome formation are poorly understood, the sites targeted by mycobacteria remain unidentified. We found that Hrs, an adaptor molecule involved in protein sorting, associates with phagosomes prior to their fusion with late endosomes or lysosomes. Recruitment of Hrs required the interaction of its FYVE domain with phagosomal phosphatidylinositol 3-phosphate, but two other attachment sites were additionally involved. Depletion of Hrs by use of small interfering RNA impaired phagosomal maturation, preventing the acquisition of lysobisphosphatidic acid and reducing luminal acidification. As a result, the maturation of phagosomes formed in Hrs-depleted cells was arrested at an early stage, characterized by the acquisition and retention of sorting endosomal markers. This phenotype is strikingly similar to that reported to occur in phagosomes of cells infected by mycobacteria. We therefore tested whether Hrs is recruited to phagosomes containing mycobacteria. Hrs associated readily with phagosomes containing inert particles but poorly with mycobacterial phagosomes. Moreover, Hrs was found more frequently in phagosomes containing avirulent Mycobacterium smegmatis than in phagosomes with the more virulent Mycobacterium marinum. These findings suggest that the inability to recruit Hrs contributes to the arrest of phagosomal maturation induced by pathogenic mycobacteria.


Figures

FIG. 1.
FIG. 1.
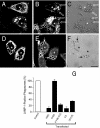
Immunostaining of endogenous and ectopically expressed Hrs. (A and B) Immunostaining of endogenous Hrs in quiescent RAW 264.7 cells (A) and in cells allowed to ingest IgG-opsonized latex beads for 10 min prior to fixation and permeabilization (B). (C) The corresponding differential interference contrast (DIC) image. (D) Detection of Hrs in phagosomes isolated from cells following a 12-min phagocytosis pulse or a 12-min pulse followed by a 10-min chase (22 min), as indicated. Identical amounts of protein (10 μg) were loaded in each lane. (E to H) Distribution of Hrs in CHO-IIA cells following ingestion of latex beads for 20 min. (E and F) Immunostaining of endogenous Hrs and the corresponding DIC image, respectively. (G and H) Distribution of myc-Hrs following transient transfection and the corresponding DIC image, respectively. (I to L) Distribution of Hrs in COS-IIA cells following ingestion of latex beads for 20 min. (I and J) Immunostaining of endogenous Hrs and the corresponding DIC image, respectively. (K and L) Distribution of myc-Hrs following transient transfection and the corresponding DIC image, respectively. The arrows point to Hrs-positive phagosomes. The images and the blot are representative of at least four experiments of each type. Bars, 10 μm.
FIG. 2.
FIG. 2.
Effects of wortmannin on Hrs recruitment to the phagosomes and localization of Hrs mutants. CHO-IIA were allowed to internalize 3-μm-diameter latex beads for 20 min and then fixed and subjected to immunostaining. Where indicated, the cells were pretreated with 100 nM wortmannin or were transfected with epitope-tagged Hrs mutants. (A to D) Distribution of wild-type Hrs in control (A and B) and wortmannin-treated (C and D) cells. (E and F) Distribution of HrsR183A. (G) Distribution of HrsFYVE+CC. (H) Distribution of HrsΔUIM. The images in panels A, C, E, G, and H are representative confocal fluorescence images. The images in panels B, D, and F are the differential interference contrast images corresponding to those in panels A, C, and E, respectively. Transfected cells are indicated by asterisks. The solid arrows point to Hrs-positive phagosomes, while open arrows indicate Hrs-deficient phagosomes. Bars, 10 μm. Images are representative of at least four experiments of each type. (I to K) Quantification of the effect of wortmannin on the phagosomal acquisition of wild-type or mutant Hrs. The cells were allowed to internalize opsonized beads for 20 min (chase time, 0 min) and then chased for the times indicated in the graph. Shown are endogenous Hrs (I), transfected wild-type Hrs (myc-tagged) (J), and HrsFYVE+CC (K). Empty columns, control cells; black columns, wortmannin-treated cells. Data are means ± standard errors of three separate experiments (200 cells were counted in each).
FIG. 3.
FIG. 3.
Effects of Hrs overexpression on LAMP-1 acquisition by phagosomes. CHO-IIA transfected with myc-tagged wild-type Hrs (A to C) or HrsR183A (D to F) were allowed to interact with opsonized latex beads for 20 min, and after unbound beads were washed, the phagosomes were allowed to mature for 60 min. The cells were then fixed and immunostained with myc (A and D) and LAMP-1 (B and E) antibodies. C and F are the corresponding DIC images. Transfected cells are identified by asterisks. The solid and open arrows point to LAMP-1-positive and -negative phagosomes, respectively. Images are representative of four experiments of each type. Bars, 10 μm. (G) Quantification of the effects of various constructs on LAMP-1 acquisition by phagosomes. CHO-IIA cells either were left untransfected (empty column) or were transfected with wild-type Hrs, HrsR183A, HrsFYVE+CC, the PX domain of p40phox or two tandem FYVE domains of EEA1, as specified. LAMP-1 acquisition by phagosomes was determined as above. Data are means ± standard errors of three experiments (200 cells counted in each).
FIG. 4.
FIG. 4.
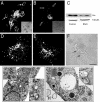
Effects of siRNA on endogenous Hrs. COS-IIA cells either were mock transfected (A, D, and Control lane in panel C) or were transfected with Hrs siRNA for 72 h. (A and B) The cells were allowed to ingest particles before immunostaining of the endogenous Hrs. Solid and open arrows point to Hrs-positive or negative phagosomes, respectively. (C) Lysates of mock-transfected cells (control) or cells transfected with Hrs siRNA were subjected to immunoblotting with antibodies to Hrs or tubulin. (D and E) EEA1 immunostaining. (F) Differential interference contrast image corresponding to that shown in panel E. Arrows point to EEA1-positive large vacuoles. Bar, 10 μm. (G and H) Transmission electron micrographs. Magnified insets reveal multivesicular bodies in mock-transfected cells (G) and spacious vacuoles in Hrs-depleted cells (H).
FIG. 5.
FIG. 5.
Effects of Hrs depletion by siRNA on phagosomal maturation. COS-IIA cells were either mock transfected (A, B, E, F, I, J, M, and N) or were transfected with Hrs siRNA for 72 h (C, D, G, H, K, L, O, and P). (A to D) Cells were fixed and permeabilized 20 min after initiation of phagocytosis and immunostained for EEA1 (A and C) and Hrs (B and D). Corresponding differential interference contrast (DIC) images are shown in insets. (E and G) Cells were allowed to internalize particles for 20 min, followed by a 3-h chase at 37°C. Next, the cells were fixed, permeabilized, and immunostained for EEA1 (E and G). Panels F and H show the corresponding DIC images. (I to P) Cells were allowed to internalize particles for 20 min followed by a 90-min chase at 37°C. (I and K) Hrs immunostaining. Insets show DIC images. (J and L) LBPA immunostaining. (M and O) Accumulation of LysoTracker. Panels N and P show the corresponding DIC images. (Q) Quantification of the effects of Hrs depletion on EEA1, LBPA, and LysoTracker acquisition by phagosomes from experiments like those illustrated in panels A to P. Staining was measured at the following times after phagocytosis: EEA1, 20 min; LBPA, 90 min; and LysoTracker, 90 min. Open columns, mock-transfected cells; black columns, cells transfected with Hrs siRNA. Data are means ± standard errors of four separate experiments (200 cells were counted in each).
FIG. 5.
FIG. 5.
Effects of Hrs depletion by siRNA on phagosomal maturation. COS-IIA cells were either mock transfected (A, B, E, F, I, J, M, and N) or were transfected with Hrs siRNA for 72 h (C, D, G, H, K, L, O, and P). (A to D) Cells were fixed and permeabilized 20 min after initiation of phagocytosis and immunostained for EEA1 (A and C) and Hrs (B and D). Corresponding differential interference contrast (DIC) images are shown in insets. (E and G) Cells were allowed to internalize particles for 20 min, followed by a 3-h chase at 37°C. Next, the cells were fixed, permeabilized, and immunostained for EEA1 (E and G). Panels F and H show the corresponding DIC images. (I to P) Cells were allowed to internalize particles for 20 min followed by a 90-min chase at 37°C. (I and K) Hrs immunostaining. Insets show DIC images. (J and L) LBPA immunostaining. (M and O) Accumulation of LysoTracker. Panels N and P show the corresponding DIC images. (Q) Quantification of the effects of Hrs depletion on EEA1, LBPA, and LysoTracker acquisition by phagosomes from experiments like those illustrated in panels A to P. Staining was measured at the following times after phagocytosis: EEA1, 20 min; LBPA, 90 min; and LysoTracker, 90 min. Open columns, mock-transfected cells; black columns, cells transfected with Hrs siRNA. Data are means ± standard errors of four separate experiments (200 cells were counted in each).
FIG. 6.
FIG. 6.
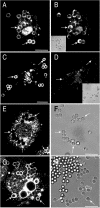
Acquisition of Hrs by phagosomes containing beads or mycobacteria. (A to F) RAW 264.7 cells were allowed to ingest M. smegmatis (A to C) or M. marinum (D to F) transformed by pG13, and the presence of EEA1 (A and D) or Hrs (B and E) on phagosomes was assessed by immunostaining. The location of the bacteria was visualized by detecting endogenously expressed GFP fluorescence (C and F). Images are representative of five experiments. (G) RAW 264.7 cells were allowed to ingest IgG-opsonized latex beads, M. smegmatis, or M. marinum, and the presence of Hrs on phagosomes was assessed by immunostaining. Extracellular adherent bacteria were identified by using antibodies and were excluded from the calculations. The presence of Hrs on phagosomes was assessed 10 min (black bars) or 20 min (open bars) after internalization. Data show the percentages of Hrs-positive phagosomes and are means ± standard errors of three independent experiments (80 to 100 phagosomes for each condition). Size bar, 5 μm.
FIG. 7.
FIG. 7.
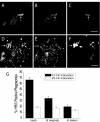
Accumulation of PI(3)P by phagosomes. RAW 264.7 cells were allowed to ingest IgG-opsonized latex beads, M. smegmatis, or M. marinum, and the presence of PI(3)P on phagosomes was assessed by transfection of 2-FYVE-GFP and fluorescence microscopy. Extracellular adherent bacteria (open arrows) were identified by using anti-Mycobacterium antibodies prior to permeabilization, followed by a Cy5-conjugated secondary antibody, and were excluded from the calculations. Total bacteria (arrows) were visualized by using anti-Mycobacterium antibodies after permeabilizing the cells, followed by a Cy3-conjugated secondary antibody. A typical experiment using M. smegmatis is illustrated in panels A to C, showing the distribution of PI3P (A) and the location of total bacteria (B) and identifying extracellular bacteria (C). A summary of similar data from multiple experiments is presented in panel D. The presence of PI(3)P on phagosomes (D) was assessed after a 20-min pulse of phagocytosis (black bars) or 10 min thereafter (open bars). Extracellular particles were removed after the 20-min pulse to preclude continued internalization during the 10-min chase. Data show the percentages of PI(3)P-positive phagosomes and are means ± standard errors of three independent experiments. Size bar, 5 μm.

Similar articles

Cited by

References

    1. Adam, T. 2001. Exploitation of host factors for efficient infection by Shigella. Int. J. Med. Microbiol. 291:287-298. - PubMed
    1. Barker, L. P., K. M. George, S. Falkow, and P. L. Small. 1997. Differential trafficking of live and dead Mycobacterium marinum organisms in macrophages. Infect. Immun. 65:1497-1504. - PMC - PubMed
    1. Bean, A. J., R. Seifert, Y. A. Chen, R. Sacks, and R. H. Scheller. 1997. Hrs-2 is an ATPase implicated in calcium-regulated secretion. Nature 385:826-829. - PubMed
    1. Bishop, N., A. Horman, and P. Woodman. 2002. Mammalian class E vps proteins recognize ubiquitin and act in the removal of endosomal protein-ubiquitin conjugates. J. Cell Biol. 157:91-101. - PMC - PubMed
    1. Chin, L. S., M. C. Raynor, X. Wei, H. Q. Chen, and L. Li. 2001. Hrs interacts with sorting nexin 1 and regulates degradation of epidermal growth factor receptor. J. Biol. Chem. 276:7069-7078. - PubMed

Publication types

MeSH terms

Substances