. 2004 May;78(10):5466-75.
doi: 10.1128/jvi.78.10.5466-5475.2004.

Regional differences in viral growth and central nervous system injury correlate with apoptosis

Affiliations

Regional differences in viral growth and central nervous system injury correlate with apoptosis

Sarah M Richardson-Burns et al. J Virol. 2004 May.

Abstract

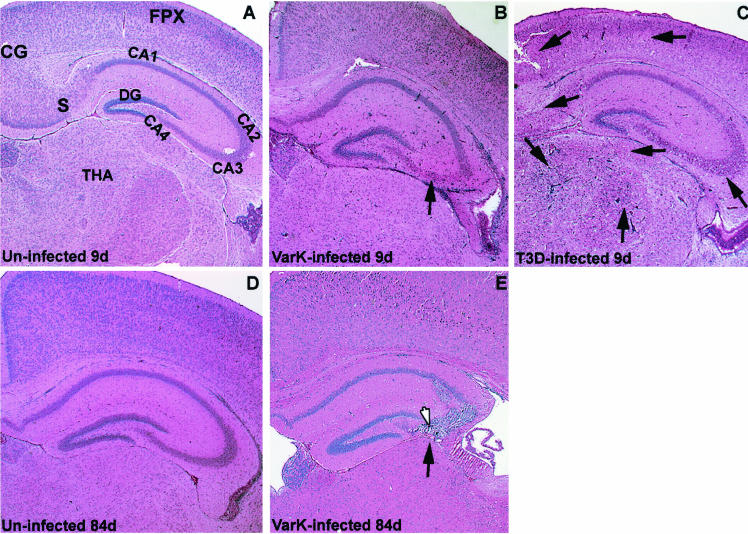
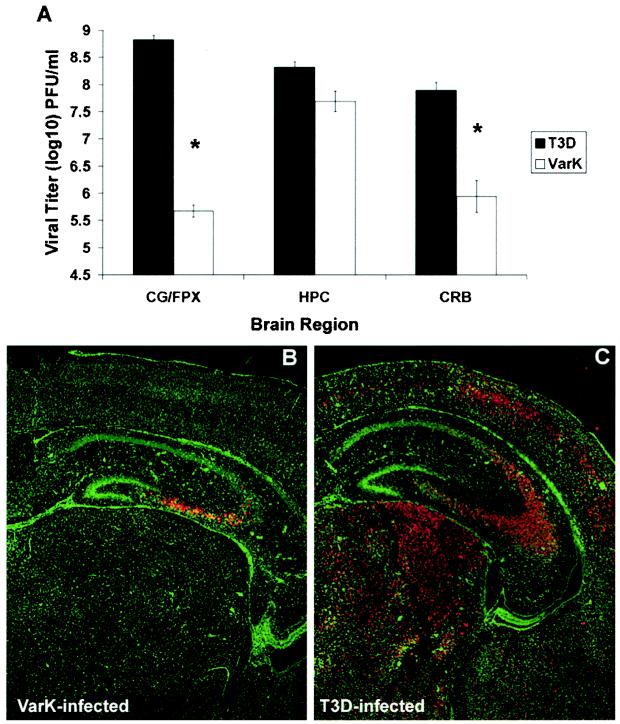
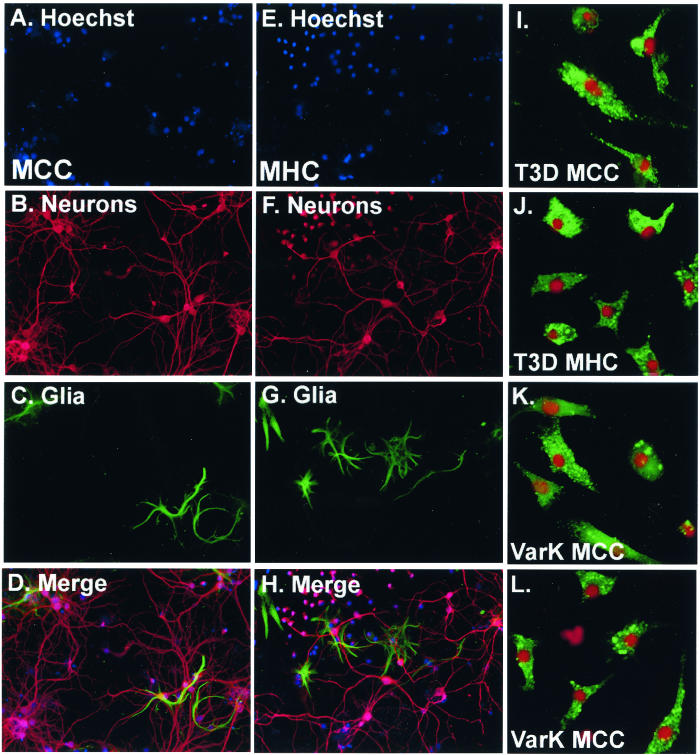
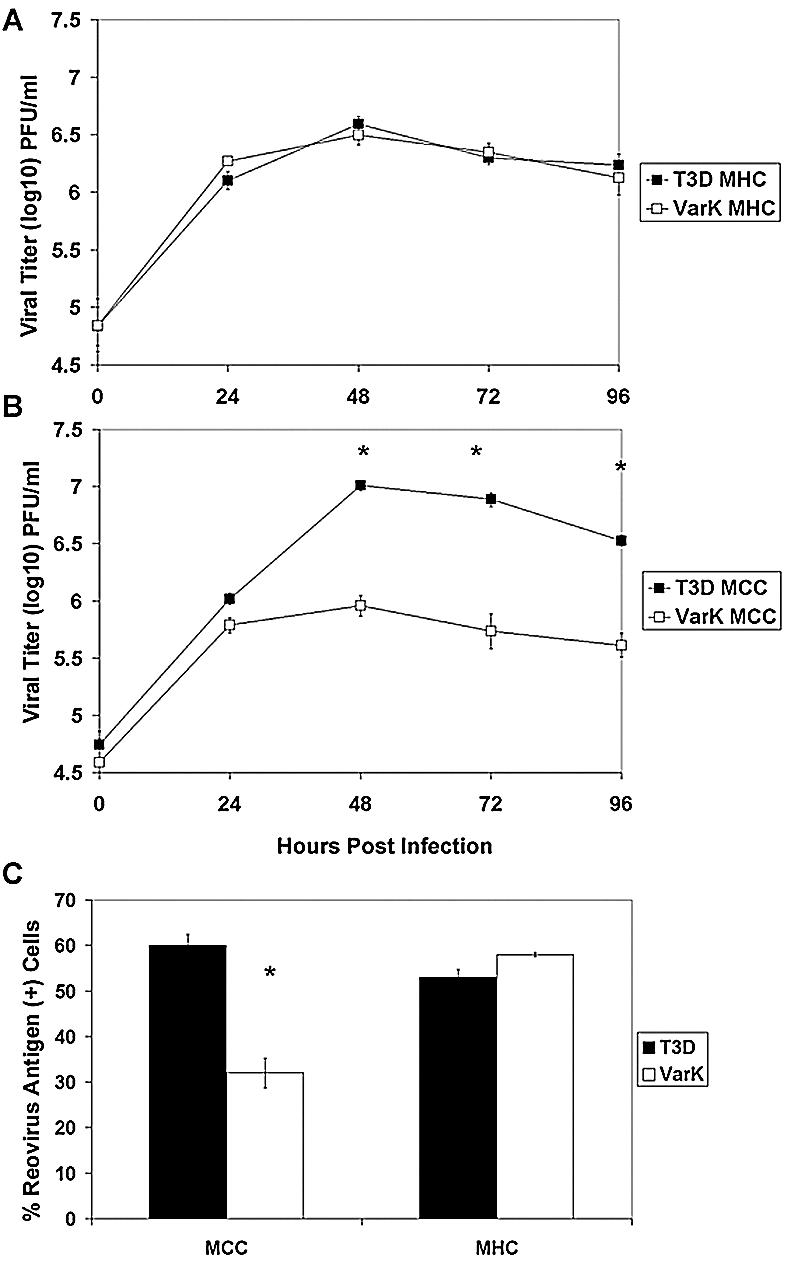
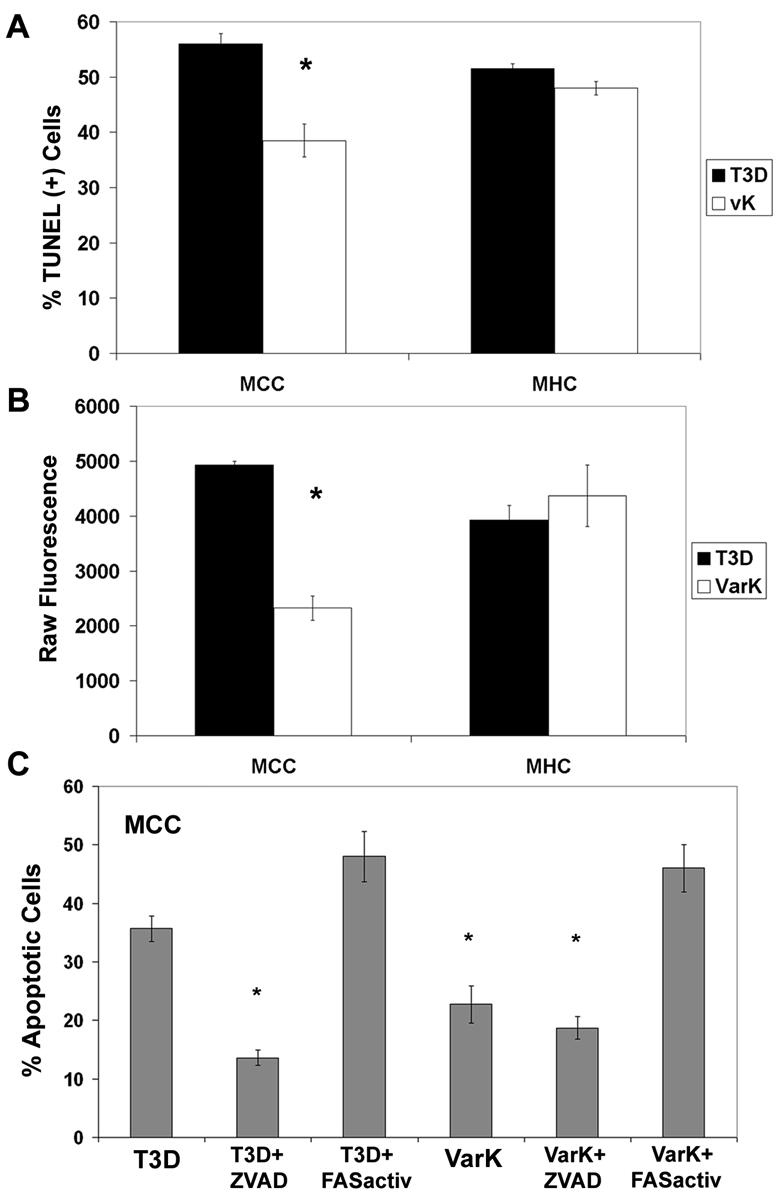
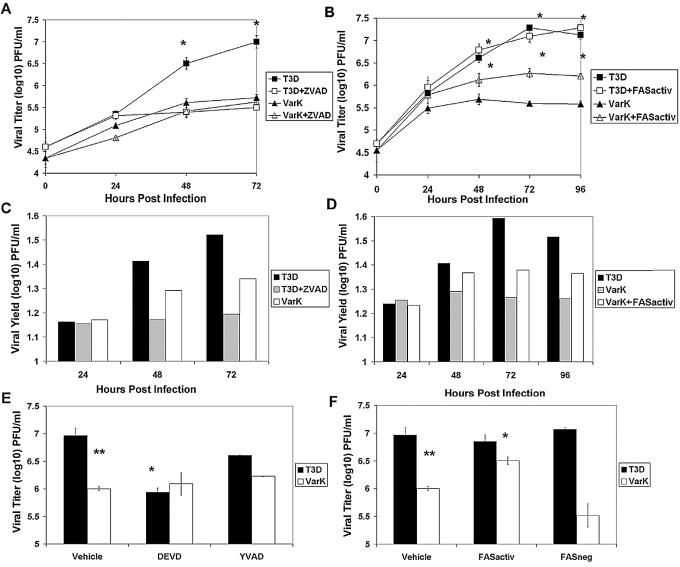
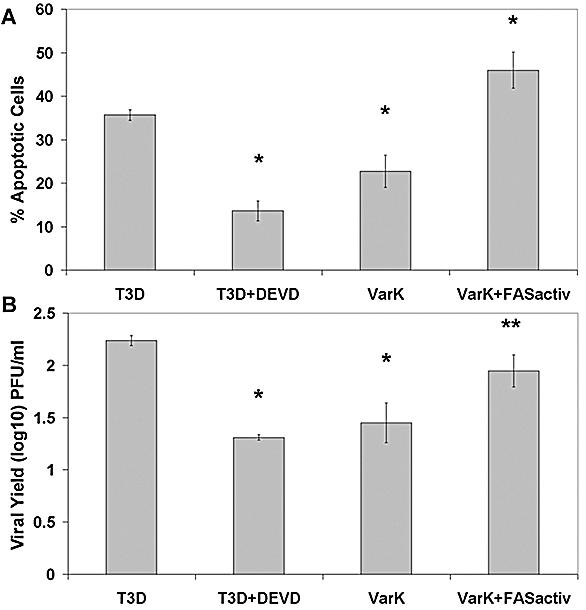
Infection of neonatal mice with reovirus T3 Dearing (T3D), the prototypic neurotropic reovirus, causes fatal encephalitis associated with neuronal injury and virus-induced apoptosis throughout the brain. T3D variant K (VarK) is an antigenic variant that has a nearly 1 million-fold reduction in neurovirulence following intracerebral (i.c.) inoculation compared to T3D and a restricted pattern of central nervous system injury with damage limited to the hippocampus, sparing other brain regions. We wished to determine whether the restricted pattern of VarK-induced injury was due to a reduced capacity to replicate in or injure cortical, as opposed to hippocampal, tissue. We found that following i.c. inoculation, VarK grew to similar titers as T3D in the hippocampus but had significantly lower titers in the cortex. Both viruses grew to identical titers and infected the same percentage of cells in mouse primary hippocampal cultures (MHC). In mouse primary cortical cultures (MCC) both the number of infected cells and the viral yield per infected cell were significantly lower for VarK than T3D. VarK-induced apoptosis was limited to the hippocampus in vivo, and in vitro both viruses induced apoptosis equally in MHC but VarK induced significantly less apoptosis than T3D in MCC. Growth of T3D in MCC was reduced to levels comparable to those of VarK following treatment of MCC with caspase inhibitors. Conversely, induction of apoptosis in VarK-infected MCC with fatty acid synthase-activating antibody significantly enhanced viral yield. These results suggest that the decreased neurovirulence of VarK may be due to its failure to efficiently induce apoptosis in cortical neurons.


Figures

FIG. 1.
FIG. 1.
VarK injures only a subset of neurons that are susceptible to T3D-induced injury, resulting in long-term loss of hippocampal cells after clearance of the virus. (A) Coronal brain section from an uninfected mouse 9 days (d) postnatal shows normal cytoarchitecture with hematoxylin and eosin histologic stain. (B) Brain section from VarK-infected mouse 7 days p.i. and 9 days postnatal shows normal cytoarchitecture and no evidence of neuronal loss in the cortical and thalamic areas but shows viral injury in the CA2 to CA3 region of the hippocampus, indicated by neuronal death and minor inflammation. (C) Brain section from a T3D-infected mouse 7 days p.i. and 9 days postnatal shows abnormal cytoarchitecture, massive cell loss, and minor inflammation throughout the cortical, hippocampal, and thalamic regions. T3D-infected mice die 7 to 9 days p.i. (D) Brain section from an uninfected mouse at 12 weeks (84 days) postnatal shows normal brain cytoarchitecture. (E) Brain section from a VarK-infected mouse 82 days p.i. and 84 days postnatal. CG, cingulate gyrus; FPX, frontoparietal cortex; S, subiculum; DG, dentate gyrus; THA, thalamic nuclei. Arrows point to areas of severe viral injury. These tissue sections are representative of data from the results of 4 studies with at least 8 mice per treatment group in each study.
FIG. 2.
FIG. 2.
VarK grows as well as T3D in the hippocampus but does not grow in other brain regions that support robust growth of T3D. (A) VarK did not grow as well as wild-type T3D in the cortex (cingulate gyrus [CG] combined with frontoparietal cortex [FPX]) or cerebellum (CRB), however VarK and T3D grew to similar titers in the hippocampus (HPC). These data are brain region viral titers from day 7 p.i. *, P < 0.01 for T3D compared to VarK titer by Tukey-Kramer. These tissue sections are representative of data from the results from 2 studies with 3 mice per treatment group in each study. (B) The coronal section of the brain from a mouse i.c. inoculated with VarK 7 days p.i. immunohistochemically stained for reovirus antigen shows that viral antigen is restricted to the CA2 to CA4 regions of the hippocampus (red staining is positive). (C) A brain section from a mouse i.c. inoculated with T3D 7 days p.i. stained for reovirus antigen shows strong positive staining (red cells) throughout the cortical, hippocampal, and thalamic regions of the brain. All neurons in brain tissue sections were counterstained with fluorescent Nissl stain (green cells). These tissue sections are representative of data from the results from 4 studies with at least 8 mice per treatment group in each study.
FIG. 3.
FIG. 3.
VarK induces apoptosis in the hippocampus but not in other regions of the CNS in infected mice. (A) A coronal section from an uninfected mouse at 9 days postnatal shows few apoptotic cells as detected by immunohistochemistry for activated caspase 3. (B) A brain section from a VarK-infected mouse 7 days p.i. shows apoptotic neurons positive for activated caspase 3 (brown cells) in the CA2 to CA4 regions of the hippocampus with very few apoptotic cells present in the cortical or thalamic regions. (C) A brain section from a T3D-infected mouse 7 days p.i. shows massive apoptosis throughout the brain regions displayed, as indicated, by cells positive for activated caspase 3 staining in the cortical, hippocampal, and thalamic areas. In both T3D- and VarK-infected mice, regions of apoptotic cells correspond to the regions of viral injury and those positive for viral antigen as seen in Fig. 1 and 2, respectively. All brain sections were counterstained with a blue stain. Arrows point to areas of strong activated caspase 3 staining. These tissue sections are representative of data from the results from 3 studies with at least 8 mice per treatment group in each study.
FIG. 4.
FIG. 4.
MCC and MHC are 75 to 95% neuronal, and only neurons are infected by T3D or VarK. (A) Nuclei in MCC prepared from E20-P0 stained with the fluorescent nuclear dye Hoechst 33342. Magnification, ×100. (B) Neurons in MCC immunocytochemically detected with anti-MAP2 (Alexa Fluor 594; red staining) show both pyramidal neurons (larger with long processes) and interneurons (smaller with little or no processes). (C) Astroglia in MCC stained with anti-GFAP (green staining) show a few positive cells. (D) The merged image shows that most cells in the culture are neurons. (E) Nuclei in MHC prepared from E20-P0 stained with the fluorescent nuclear dye Hoechst 33342. (F) Neurons in MHC immunocytochemically detected with anti-MAP2 (Alexa Fluor 594; red staining) show both pyramidal neurons (larger with long processes) and interneurons (smaller with little or no processes). (G) Astroglia in MHC stained with anti-GFAP (green staining) show a few positive cells. (H) The merged image shows that most cells in the culture are neurons. (I) T3D-infected MCC dual labeled for reovirus antigen (anti-T3D polyclonal, green staining) and the neuronal nucleus marker NeuN (Cy3; red staining) shows that infected cells (antigen in cytoplasm) are neurons. Magnification, ×400. (J) T3D-infected MHC dual labeled for reovirus antigen (green) and the neuronal nucleus marker NeuN (red). (K) VarK-infected MCC dual labeled for reovirus antigen (green) and the neuronal nucleus marker NeuN (red). (L) VarK-infected MHC dual labeled for reovirus antigen (green) and the neuronal nucleus marker NeuN (red).
FIG. 5.
FIG. 5.
Capacity of VarK to infect and grow in primary hippocampal and cortical neuronal cultures parallels its in vivo phenotype. (A) T3D and VarK grow to similar titers in MHC; (B) in MCC, T3D grows significantly better than VarK. *, P < 0.05 by Tukey-Kramer. (C) MCC and MHC were infected with either T3D or VarK, and immunocytochemistry was performed to detect the percentage of virus-infected cells at 48 h p.i. The percentage of cells positive for viral antigen was quantified in each culture. *, P < 0.01 by Tukey-Kramer. These data are representative of viral growth assays performed for at least three individual samples of primary cultures from three to four different culture preparations.
FIG. 6.
FIG. 6.
VarK induced significantly less apoptosis than T3D in MCC, but in MHC, VarK and T3D kill an equal percentage of cells. (A) TUNEL, a marker for apoptosis-associated DNA fragmentation, was performed on MCC, and MHC were infected with either T3D or VarK at 48 h p.i. Significantly fewer MCC were TUNEL positive after VarK infection than after T3D infection, whereas T3D- and VarK-infected MHC had similar percentages of TUNEL-positive cells. (B) Another assay for apoptosis which detects the total level of activated caspase 3, an apoptosis-specific protease in cell lysate, by fluorogenic substrate cleavage. Increases in raw fluorescence of the cell lysate correspond to increases in levels of activated caspase 3 present in the lysate. By 24 h p.i., there was significantly more activated caspase 3 in T3D-infected MCC than in VarK-infected MCC. At the same time, activated caspase 3 levels in MHC infected with T3D or VarK were the same. *, P < 0.01 by Tukey-Kramer. These data are representative of apoptosis assays performed with at least three individual samples of primary cultures from three to four different culture preparations. (C) Apoptosis morphology assay (percent apoptosis in mock-infected control MCC subtracted from all treatments) at 48 h p.i. in MCC infected with either T3D or VarK (MOI of 100) and treated with caspase inhibitor ZVAD (25 μM in dimethyl sulfoxide), anti-FASactiv (0.25 μg/ml), or dimethyl sulfoxide (vehicle control). *, P < 0.01 by Tukey-Kramer.
FIG. 7.
FIG. 7.
Inhibiting apoptosis reduces growth of T3D, and augmenting apoptosis enhances growth of VarK in cortical neurons. (A) ZVAD treatment of T3D-infected MCC but not VarK-infected MCC results in a significant reduction in viral titer by 48 h p.i. Viral titer and the growth kinetics of ZVAD-treated T3D-infected MCC resembled those of VarK-infected MCC. *, P < 0.01 for T3D versus T3D plus ZVAD by Tukey-Kramer). (B) Anti-FASactiv (0.25 μg/ml) added at 18 h p.i. to T3D- or VarK-infected MCC significantly increased VarK viral titer in MCC but did not increase titer to levels seen in T3D-infected MCC. *, P < 0.05 for T3D versus VarK plus FASactiv and VarK plus FASactiv versus VarK by Tukey-Kramer). (C) ZVAD treatment of T3D-infected MCC reduces viral yield in MCC compared to untreated T3D-infected cells. Viral yield was calculated by dividing the total viral titer at one time point by the viral titer at time 0 h p.i. (D) Anti-FASactiv treatment increased VarK viral yield compared to untreated VarK-infected MCC at all times p.i. after addition to the cultures. (E) Viral titer at 48 h p.i. for T3D- and VarK-infected MCC treated with either vehicle (2 μl of dimethyl sulfoxide), caspase 3 inhibitor DEVD (15 μM in dimethyl sulfoxide), or caspase 1 inhibitor YVAD (15 μM in dimethyl sulfoxide). As previously seen, T3D and VarK have significantly different titers at 48 h p.i. in MCC. **, P < 0.01. DEVD but not YVAD treatment significantly reduced T3D viral titer at 48 h p.i., bringing the T3D titer to the same level as the VarK titer. *, P < 0.05. Neither treatment has an effect on VarK titer. (F) Viral titers of T3D and VarK at 48 h p.i. in MCC treated with either vehicle (2 μl of PBS), anti-FASactiv or anti-FASnegative antibody (control antibody, 0.25 μg in 2 μl of PBS). Anti-FASactiv but not FASneg antibody significantly increased VarK viral titer in MCC at 48 h p.i. *, P < 0.05 for VarK plus FASactiv versus VarK. Neither antibody had an effect on the T3D viral titer. These data are representative of viral growth assays performed with primary cultures from at least four different culture preparations and apoptosis assays performed with two MCC preparations.
FIG. 8.
FIG. 8.
Higher percentage of apoptosis in MCC corresponds to higher viral yield. (A) The percentage of apoptosis was quantified at 48 h p.i. in T3D, T3D plus DEVD, VarK, or VarK plus FASactivating antibody-treated MCC. T3D induced significantly greater levels of apoptosis than T3D plus DEVD or VarK alone. *, P < 0.01. T3D alone was not different than VarK plus FASactiv. T3D plus DEVD was not different than VarK alone. The percentage of apoptosis in control mock-infected MCC was subtracted from each treatment prior to graphing. Apoptosis was measured by staining fixed cells with Hoechst 3342 and counting cells with condensed and/or fragmented nuclei. (B) The viral yield in MCC at 48 h p.i. was quantified for each treatment: T3D, T3D plus DEVD, VarK, or VarK plus FASactiv. DEVD treatment significantly inhibited T3D growth, making T3D plus DEVD titers similar to that of VarK alone. *, P < 0.01. VarK grew significantly better in the presence of FASactiv, growing to titers similar to those with T3D. **, P < 0.05.

Similar articles

Cited by

References

    1. Barton, E. S., J. L. Connolly, J. C. Forrest, J. D. Chappell, and T. S. Dermody. 2001. Utilization of sialic acid as a coreceptor enhances reovirus attachment by multistep adhesion strengthening. J. Biol. Chem. 276:2200-2211. - PubMed
    1. Barton, E. S., J. C. Forrest, J. L. Connolly, J. D. Chappell, Y. Liu, F. J. Schnell, A. Nusrat, C. A. Parkos, and T. S. Dermody. 2001. Junction adhesion molecule is a receptor for reovirus. Cell 104:441-451. - PubMed
    1. Bassel-Duby, R., D. R. Spriggs, K. L. Tyler, and B. N. Fields. 1986. Identification of attenuating mutations on the reovirus type 3 S1 double-stranded RNA segment with a rapid sequencing technique. J. Virol. 60:64-67. - PMC - PubMed
    1. Chappell, J. D., V. L. Gunn, J. D. Wetzel, G. S. Baer, and T. S. Dermody. 1997. Mutations in type 3 reovirus that determine binding to sialic acid are contained in the fibrous tail domain of viral attachment protein sigma1. J. Virol. 71:1834-1841. - PMC - PubMed
    1. Chappell, J. D., A. E. Prota, T. S. Dermody, and T. Stehle. 2002. Crystal structure of reovirus attachment protein sigma1 reveals evolutionary relationship to adenovirus fiber. EMBO J. 21:1-11. - PMC - PubMed

Publication types

Substances