. 2004 Apr;123(4):455-67.
doi: 10.1085/jgp.200309005.

Molecular surface of tarantula toxins interacting with voltage sensors in K(v) channels

Affiliations

Molecular surface of tarantula toxins interacting with voltage sensors in K(v) channels

Julia M Wang et al. J Gen Physiol. 2004 Apr.

Abstract

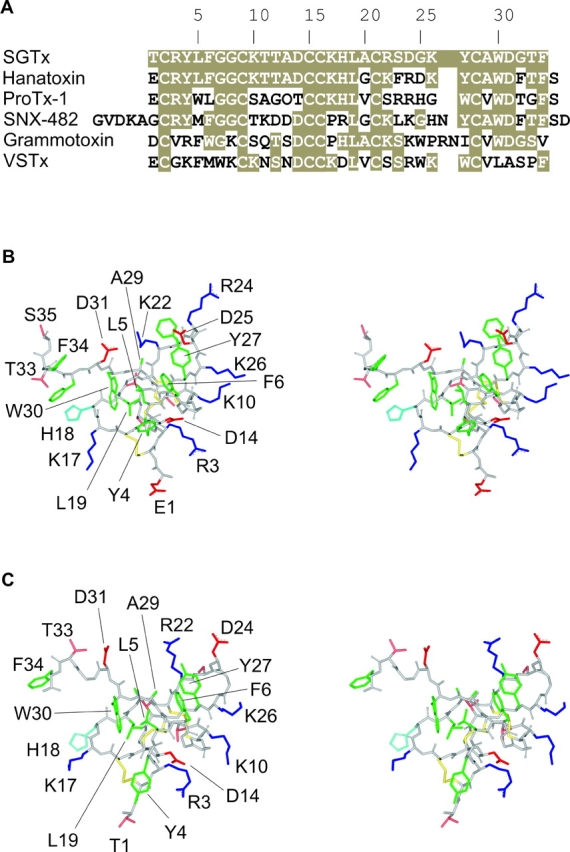
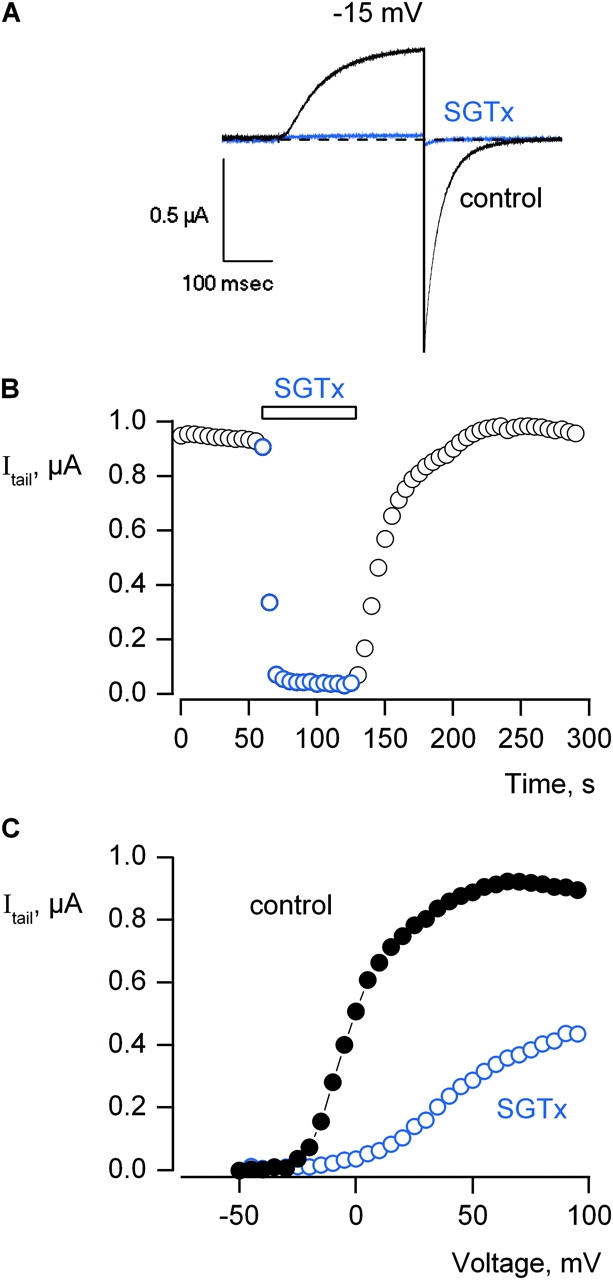
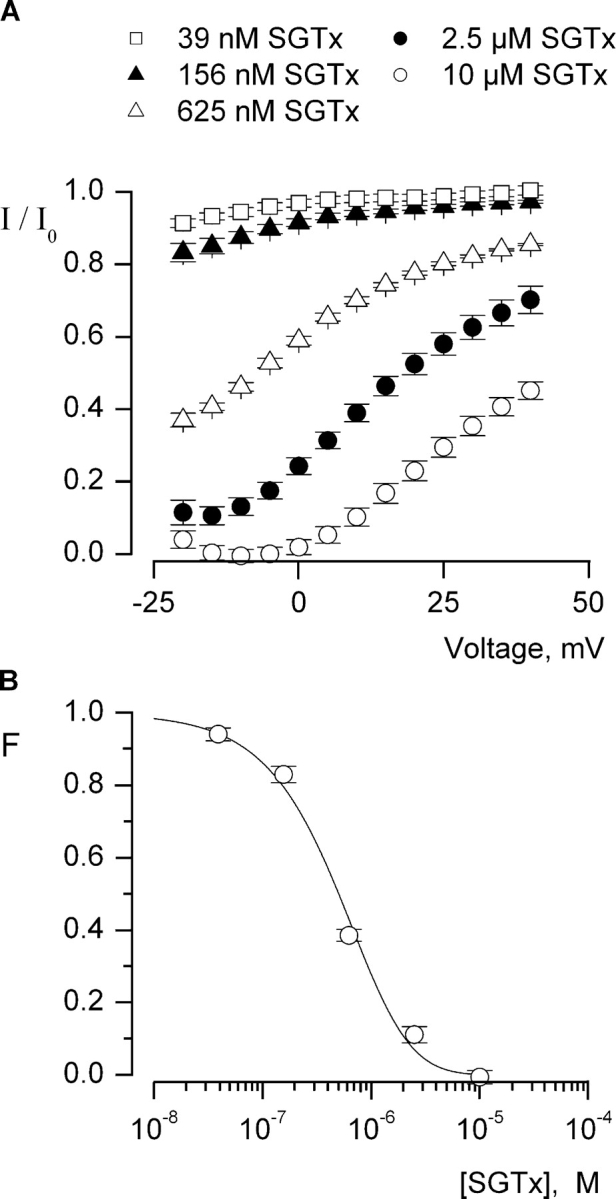
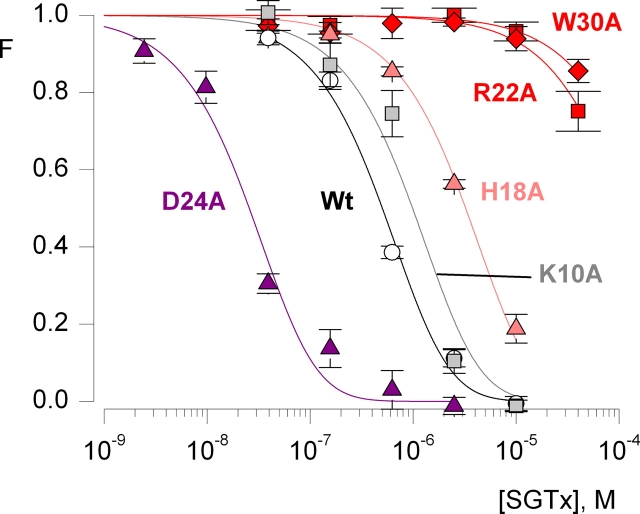
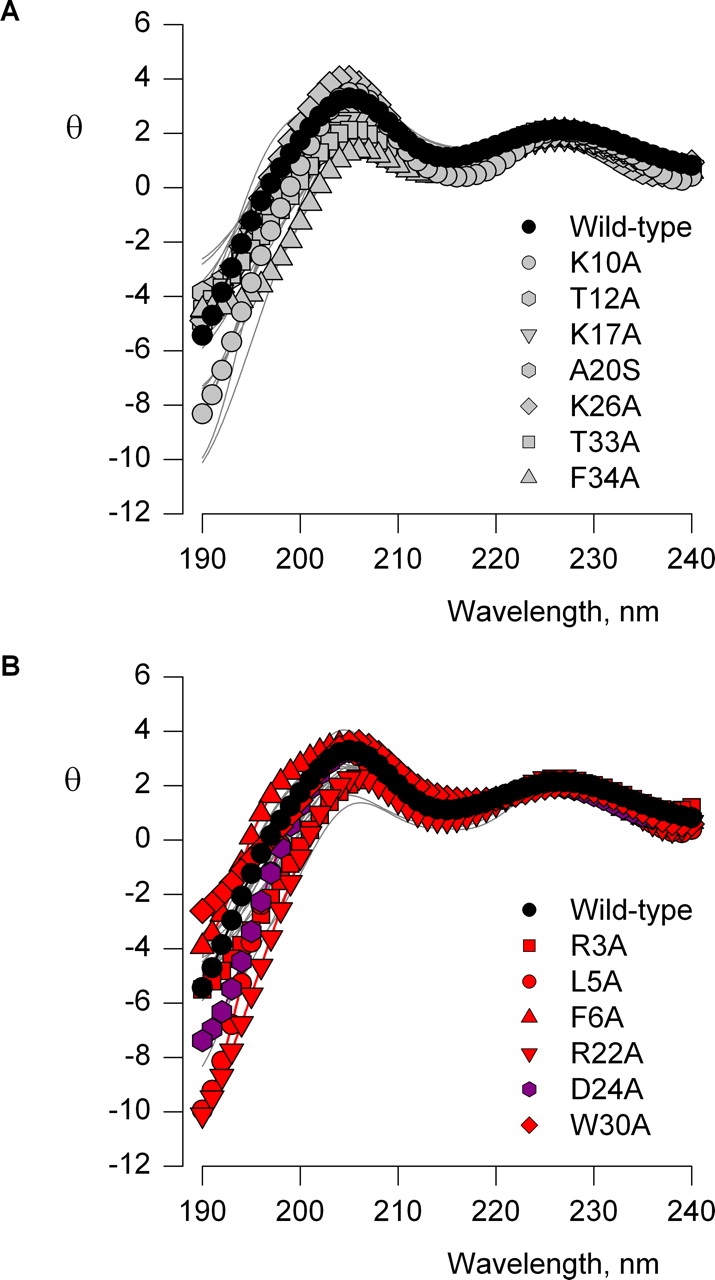
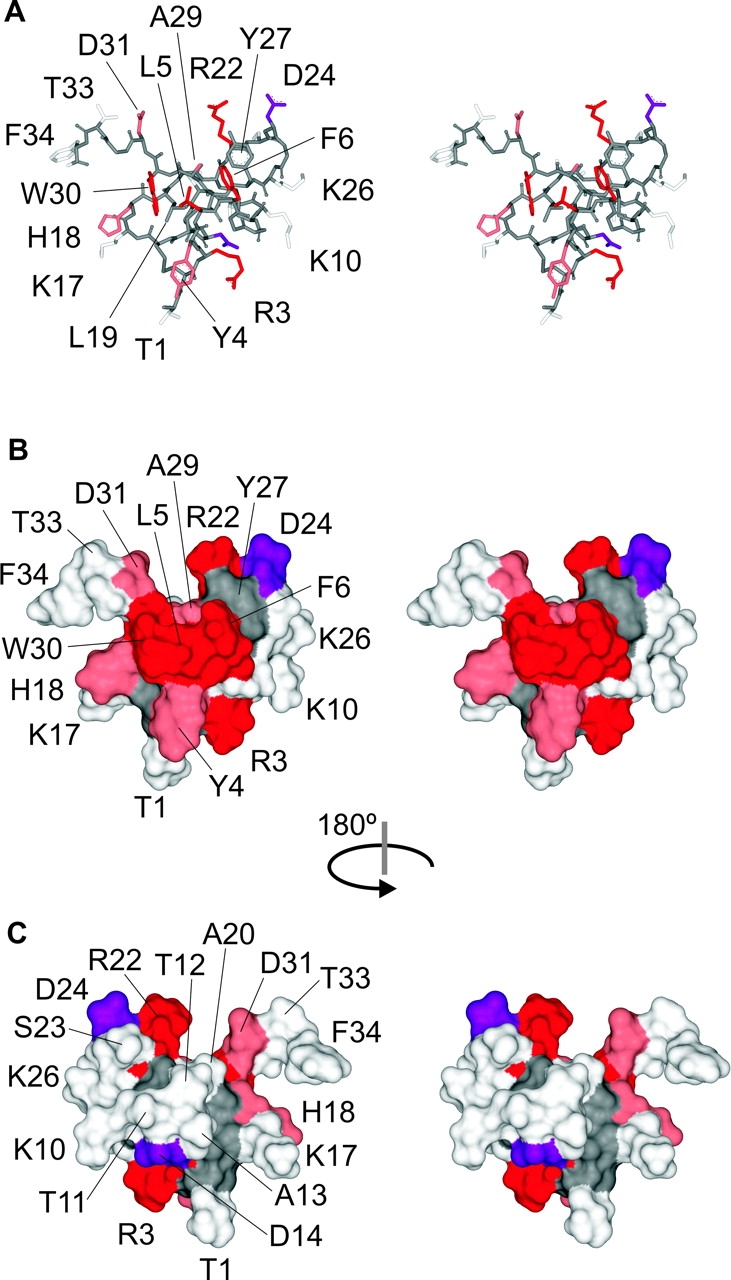
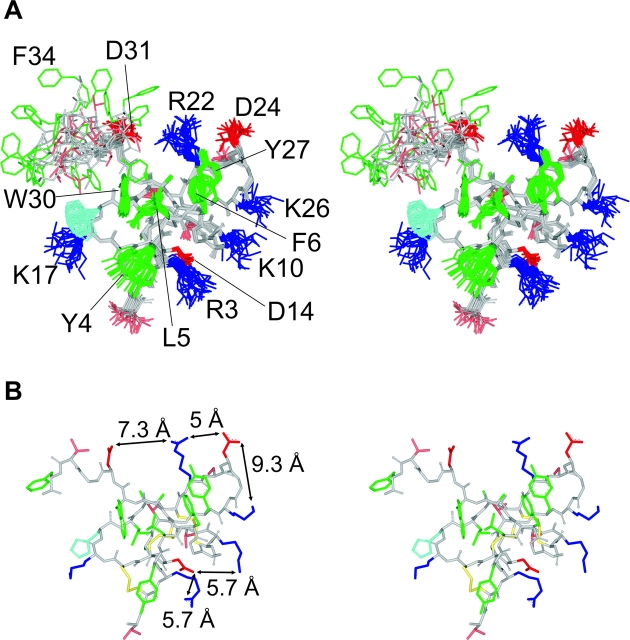
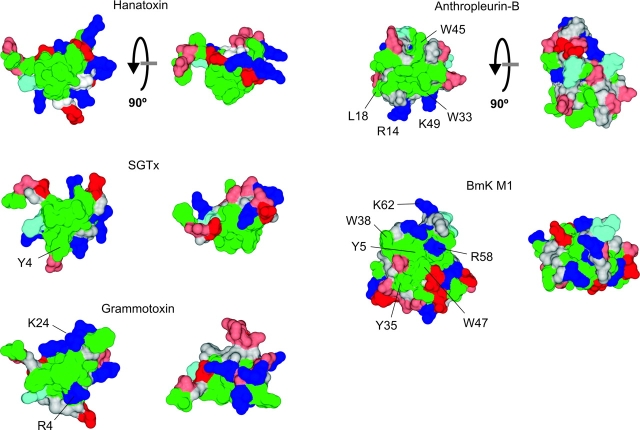
The venom from spiders, scorpions, and sea anemone contain a rich diversity of protein toxins that interact with ion channel voltage sensors. Although atomic structures have been solved for many of these toxins, the surfaces that are critical for interacting with voltage sensors are poorly defined. Hanatoxin and SGTx are tarantula toxins that inhibit activation of K(v) channels by interacting with each of the four voltage sensors. In this study we set out to identify the active surface of these toxins by alanine-scanning SGTx and characterizing the interaction of each mutant with the K(v)2.1 channel. Examination of the concentration dependence for inhibition identified 15 mutants with little effect on the concentration dependence for toxin inhibition of the K(v)2.1 channel, and 11 mutants that display moderate to dramatic perturbations. Mapping of these results onto the structure of SGTx identifies one face of the toxin where mutations with pronounced perturbations cluster together, and a backside of the toxin where mutations are well tolerated. The active surface of SGTx contains a ring-like assembly of highly polar residues, with two basic residues that are particularly critical, concentrically arranged around a hydrophobic protrusion containing critical aliphatic and aromatic residues. These results identify the active surface of the toxin and reveal the types of side chains that are important for interacting with voltage sensors.


Figures

F<sc>igure</sc> 1.
Figure 1.
Structures of toxins interacting with the voltage-sensors. (A) Sequence alignment for toxins interacting with voltage sensors. Tan shading indicates similarity to SGTx. (B) Stereo views of the hanatoxin NMR solution structure (PDB accession code 1D1H) shown as a stick model. Side chain coloring as follows: hydrophobic (green), basic (blue), His (light blue), acidic (red), both Ser and Thr (pink), and disulfide bonds in yellow. Backbone atoms are colored light gray. (C) Stereo views of the SGTx NMR solution structure (PDB accession code 1LA4) shown as a stick model. Same color scheme as in B. Structures here and in all subsequent figures were generated using DS Viewer Pro (Accelrys).
F<sc>igure</sc> 2.
Figure 2.
Inhibition of the Kv2.1 channel by SGTx. (A) Current records were elicited by depolarization to −15 mV in the absence (black trace) and presence (blue trace) of 2.5 μM SGTx. Holding voltage was −90 mV and tail voltage was −50 mV. Dashed line indicates the level of zero current. (B) Time course for inhibition of the Kv2.1 channel by 2.5 μM SGTx. Current records were elicited by depolarizations to −15 mV every 5 s. Holding voltage was −90 mV and tail voltage was −50 mV. Same cell as in A. (C) Voltage-activation relations in the absence and presence of 10 μM SGTx. Tail currents obtained following various strength depolarizations were averaged for 0.4 ms beginning 3.4 ms after repolarization to−50 mV. Holding voltage was −90 mV and tail voltage was −50 mV. Same subtraction protocol as in A. In all cases, leak, background, and capacitive currents were subtracted after blocking the channel with agitoxin-2.
F<sc>igure</sc> 3.
Figure 3.
Concentration dependence for fractional occupancy of the Kv2.1 channel by SGTx. (A) Fraction of uninhibited tail currents in the presence of various concentrations of SGTx. Currents were elicited by depolarization to voltages between−25 and +40 mV (5-mV increments) from a holding potential of −90 mV and a tail voltage of −50 mV. I and I0 represent tail currents in the presence and absence of SGTx, respectively, measured 2.3 ms after repolarization to −50 mV and averaged over 0.3 ms. Symbols represent mean ± SEM for 5–10 cells at each concentration. (B) Concentration dependence for fractional occupancy of the Kv 2.1 channel by SGTx. Plot of fraction unbound (F) for varying concentrations of SGTx. Fraction unbound is the fraction of uninhibited tail current for weak depolarizations (taken from −20 to −10 mV). Data points are mean ± SEM for 7 to 11 cells at each concentration of toxin. Solid line is a fit of F = (1 − p)4 to the data, where F is the probability of having a channel with no SGTx bound (with each channel having four equivalent and independent binding sites) and p = [SGTx]/[SGTx] + Kd with a Kd of 2.7 μM.
F<sc>igure</sc> 4.
Figure 4.
Concentration dependence for fractional occupancy of the Kv2.1 channel by SGTx mutants. Fraction unbound (F) plotted as a function of SGTx concentration for the wild-type toxin and five Ala mutants. Determinations of F and fitting of a four site model to the data are as described in text and Fig 3. Data points are mean ± SEM for 3 to 11 cells at each toxin concentration. K10A (light gray) is an example of a mutant that does not significantly alter Kd (|ΔΔG| < 1 kcal mol−1). H18A (pink) is an example of a mutant that displays a moderately higher Kd (|ΔΔG| = 1–1.5 kcal mol−1), and both R22A and W30A (red) are examples of mutants with dramatically higher Kd values (|ΔΔG| > 1.5 kcal mol−1). D24A (purple) is an example of a mutant that displays a lower Kd. See Table I for Kd and ΔΔG values for all mutants.
F<sc>igure</sc> 5.
Figure 5.
Circular dichroism spectra for SGTx mutants. Ellipticity (θ) plotted against wavelength for wild-type SGTx (filled black circles) and 26 SGTx mutants (light gray lines). θ (× 103) has units of deg cm2 dmol−1. In A, seven mutants are shown in gray symbols where |ΔΔG| < 1 kcal mol−1 and in B, six mutants are shown in red or purple where |ΔΔG| > 1.5 kcal mol−1. The red residues have increased Kd values while the purple residue has a decreased Kd value.
F<sc>igure</sc> 6.
Figure 6.
Mapping of perturbations onto the SGTx structure. (A) Stereo pair of the SGTx NMR solution structure shown as a stick representation. Backbone atoms and unstudied residues (L19, Y27, and 6 Cys) are colored dark gray. Mutants that do not significantly alter Kd (|ΔΔG| < 1 kcal mol−1) are colored light gray. Mutants that display weaker binding affinity are colored pink if |ΔΔG| = 1–1.5 kcal mol−1 and red if |ΔΔG| > 1.5 kcal mol−1. Two mutants displaying stronger binding affinity are colored purple. See Table I for Kd and ΔΔG values for all mutants. (B) Stereo pair of the SGTx structure shown as surface renderings with a probe radius of 1 Å. Same coloring scheme as in A. (C) Stereo surface renderings as in B except that the structure was rotated 180° about the indicated axis.
F<sc>igure</sc> 7.
Figure 7.
Position of polar residues in SGTx. (A) Stereo pairs of the 20 final converged structures of SGTx shown as a stick representation. Side chain colors are as follows: green for hydrophobic, dark blue for basic, light blue for His, red for acidic, and pink for both Ser and Thr. Backbone atoms are colored light gray. (B) Stereo pair of the lowest XPLOR-energy structure of SGTx.
F<sc>igure</sc> 8.
Figure 8.
Structures of toxins that bind to voltage-sensors. Surface renderings of five toxins that bind to voltage-sensors in voltage-gated ion channels. Structures to the right were obtained by rotating structures on the left by 90° about the axis shown. Probe radius is 1 Å and coloring as in Fig 7. Structures of hanatoxin, SGTx, grammotoxin (1KOZ), and anthropleurin-B (1APF) were determined using NMR while the structure of BmK M1 (1SN1) was determined using X-ray diffraction. Mutation of residues labeled in anthropleurin-B and BmK M1 cause decreases in toxin binding to Nav channels.

Similar articles

Cited by

References

    1. Aggarwal, S.K., and R. MacKinnon. 1996. Contribution of the S4 segment to gating charge in the Shaker K+ channel. Neuron. 16:1169–1177. - PubMed
    1. Anderson, C.S., R. MacKinnon, C. Smith, and C. Miller. 1988. Charybdotoxin block of single Ca2+-activated K+ channels. Effects of channel gating, voltage, and ionic strength. J. Gen. Physiol. 91:317–333. - PMC - PubMed
    1. Boland, L.M., J.A. Morrill, and B.P. Bean. 1994. ω-Conotoxin block of N-type calcium channels in frog and rat sympathetic neurons. J. Neurosci. 14:5011–5027. - PMC - PubMed
    1. Bourinet, E., S.C. Stotz, R.L. Spaetgens, G. Dayanithi, J. Lemos, J. Nargeot, and G.W. Zamponi. 2001. Interaction of SNX482 with domains III and IV inhibits activation gating of α(1E) (Ca(V)2.3) calcium channels. Biophys. J. 81:79–88. - PMC - PubMed
    1. Cestele, S., and W.A. Catterall. 2000. Molecular mechanisms of neurotoxin action on voltage-gated sodium channels. Biochimie. 82:883–892. - PubMed

Publication types

Substances