. 2004 May 15;557(Pt 1):77-91.
doi: 10.1113/jphysiol.2004.062158. Epub 2004 Mar 5.

Effects of wortmannin and latrunculin A on slow endocytosis at the frog neuromuscular junction

Affiliations

Effects of wortmannin and latrunculin A on slow endocytosis at the frog neuromuscular junction

D A Richards et al. J Physiol. .

Abstract

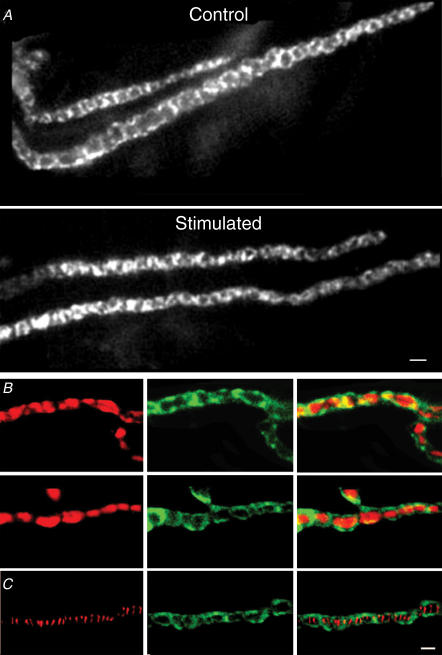
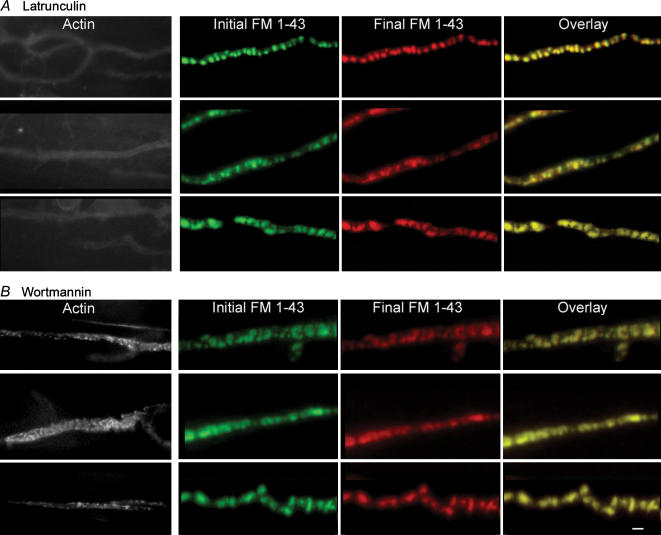
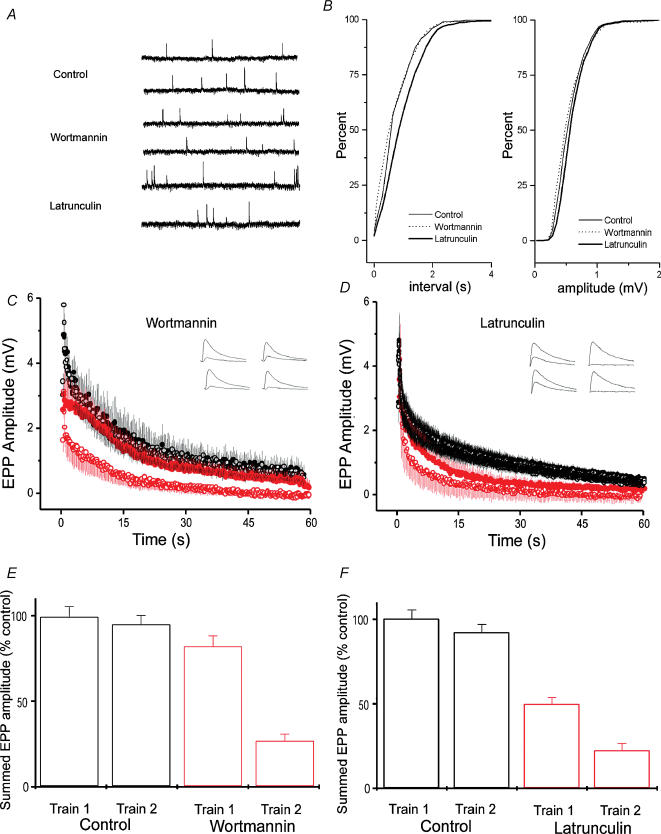
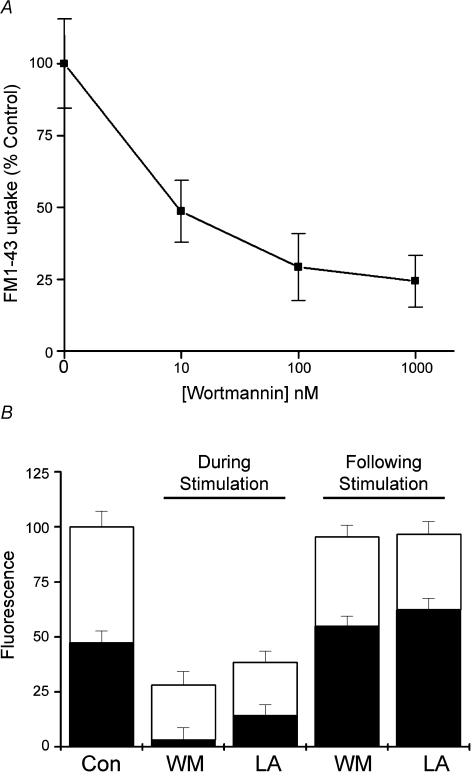
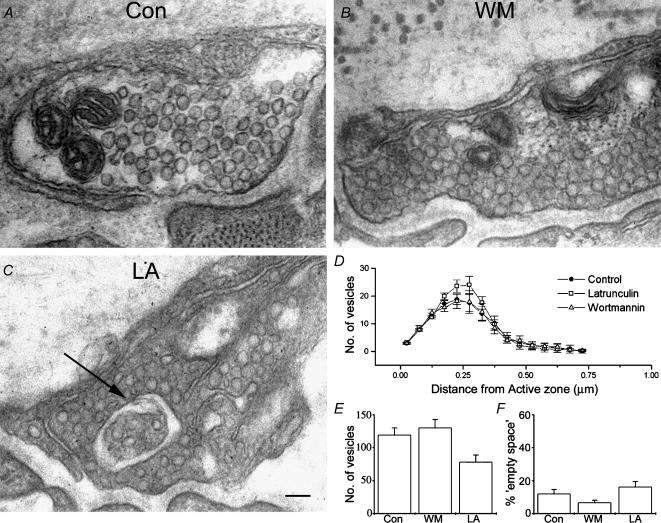
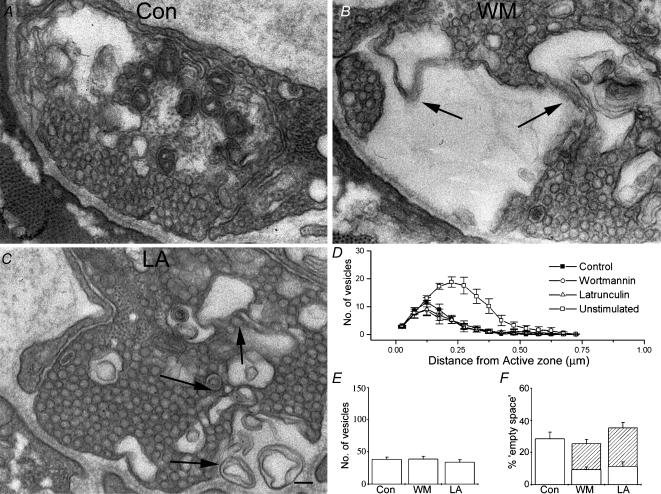
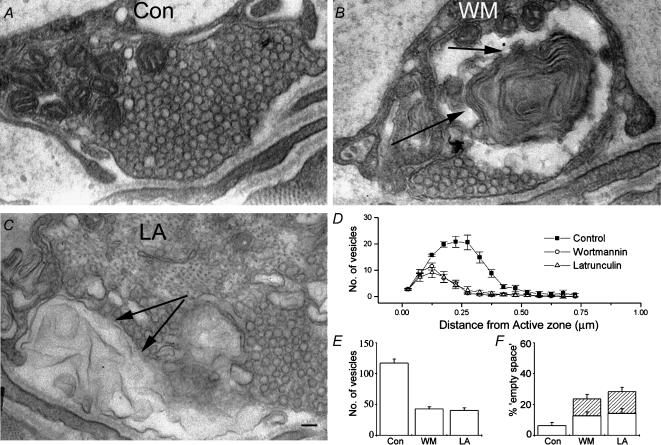
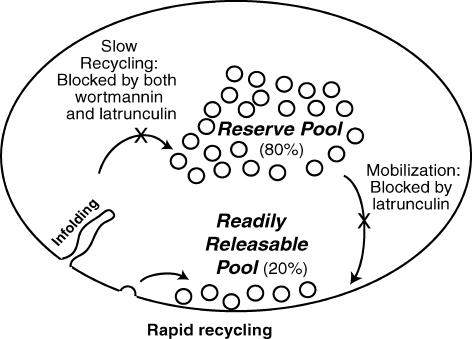
Phosphoinositides are key regulators of synaptic vesicle cycling and endocytic traffic; the actin cytoskeleton also seems to be involved in modulating these processes. We investigated the effects of perturbing phosphoinositide signalling and actin dynamics on vesicle cycling in frog motor nerve terminals, using fluorescence and electron microscopy, and electrophysiology. Antibody staining for beta-actin revealed that actin surrounds but does not overlap with synaptic vesicle clusters. Latrunculin A, which disrupts actin filaments by binding actin monomers, and wortmannin, an inhibitor of phosphatidyl inositol-3-kinase (PI3-kinase), each disrupted the pattern of presynaptic actin staining, but not vesicle clusters in resting terminals. Latrunculin A, but not wortmannin, also reduced vesicle mobilization and exocytosis. Both drugs inhibited the stimulation-induced uptake of the styryl dye FM1-43 and blocked vesicle reformation from internalized membrane objects after tetanic stimulation. These results are consistent with a role of PI3-kinase and the actin cytoskeleton in the slow pathway of vesicle endocytosis, used primarily by reserve pool vesicles.


Figures

Figure 1
Figure 1. β-Actin surrounds synaptic vesicle clusters
A, an example of anti-β-actin staining in control (upper) and stimulated (lower) nerve terminals. The staining forms regular rings along the length of the control nerve terminal. The right panel shows a nerve terminal stimulated for 5 min at 30 Hz immediately prior to fixation; here the actin staining is less regular, as though it has been partially disrupted. Scale bar = 2 μm. B, two examples of nerve terminals loaded with FM4-64 (left-hand column), then fixed and stained for β-actin (middle column). The images are merged in the images in the right-hand column, which show little overlap. C, staining of postsynaptic acetylcholine receptors with rhodamine-conjugated α-bungarotoxin (left-hand panel) and of β-actin (middle panel). The right-hand panel is an overlay image, showing that the actin surrounds areas that lie directly above the postsynaptic folds. Scale bar = 1 μm for B and C.
Figure 2
Figure 2. Disruption of β-actin does not affect vesicle clustering in resting terminals
A, three typical examples show that latrunculin A destroyed actin staining (left-hand column; images were acquired with increased illumination and longer exposure times). Images of FM1-43 staining patterns before (second column) and after (third column) latrunculin A treatment are overlaid (right-hand column), and show virtually no change. B, wortmannin disrupted actin staining (layout like A) in a manner similar to nerve stimulation, although more severe. Vesicle clusters were not affected. Scale bar = 1 μm.
Figure 3
Figure 3. Disruption of presynaptic actin and PI signalling reduces transmitter release during tetanic stimulation
A, examples of mEPPs recorded from muscles from control preparations, following wortmannin treatment and following latrunculin A treatment. B, analysis of mEPPs, recorded from 5–7 preparations. Cumulative frequency plots for inter-event interval (left-hand panel) and amplitude (right-hand panel). No significant changes in amplitude were observed in latrunculin- or wortmannin-treated preparations, although a small reduction in frequency was observed in latrunculin A-treated preparations. C, EPP amplitudes during tetanic stimulation in control (black) and wortmannin-treated (red) preparations. Synaptic depression during a 1 min, 30 Hz train was normal during a first train in wortmannin-treated preparations (upper red curve). However, a second train applied 20 min after the first showed severe depression (lower red curve; n = 8, P < 0.001). Control responses during the two trains superimpose (n = 8). D, synaptic rundown in latrunculin A-treated preparations. Synaptic depression during a 1 min, 30 Hz train was faster during a first train in latrunculin A-treated preparations (n = 8, P < 0.01). A second train applied 20 min after the first showed greatly enhanced rundown (P < 0.001). E, summed EPPs, normalized to the amount of release in control preparations, are plotted for first and second trains in control and wortmannin-treated preparations. Release was normal during the first train in wortmannin, but was greatly reduced during a second train given 20 min after the first. F, summed EPPs, normalized to control preparations, are plotted for first and second trains in control and latrunculin A-treated preparations. Release was reduced during the first train in latrunculin A-treated preparations, and reduced even more during a second train given 20 min after the first.
Figure 4
Figure 4. Disruption of presynaptic actin and PI signalling impairs vesicle cycling
A, dose–response curve for the effect of wortmannin on the uptake of FM1-43. Terminals were stimulated for 1 min at 30 Hz in the presence of FM1-43, after incubation with various concentrations of wortmannin for 1 h. B, comparison between uptake (total height of bars) and release (open sections of bars) of FM1-43 following treatment with wortmannin (WM) and latrunculin A (LA). Both agents significantly reduced the uptake of FM1-43 compared to control (Con) preparations if applied before loading (n = 5–6, P < 0.01); interestingly, nearly all dye internalized after wortmannin treatment could be released. If the drugs were applied after FM1-43 was loaded, no significant effect was seen.
Figure 5
Figure 5. Morphology of resting nerve terminals is normal following treatment with latrunculin and wortmannin
A, a representative electron micrograph of an untreated, unstimulated nerve terminal. B, a representative wortmannin-treated preparation, showing normal ultrastructure. C, an electron micrograph of a latrunculin-treated preparation, illustrating the type of anomaly sometimes seen in these preparations (arrow). Scale bar = 100 nm D, quantification of numbers of vesicles plotted against distance from the active zone. No significant difference was observed between treatments. E, total number of vesicles seen in terminals for each treatment. F, ‘empty space’ observed in resting nerve terminals. No significant difference was seen between preparations. Data plotted in panels B–D are mean values obtained from > 20 terminals, from 5 preparations each.
Figure 6
Figure 6. Both latrunculin and wortmannin perturb the morphology of stimulated nerve terminals
A, a typical electron micrograph of a control nerve terminal following stimulation. B, wortmannin treatment, coupled to stimulation, results in a severe perturbation of nerve terminal ultrastructure. Arrows indicate unusual multilamellar membrane structures seen in these and latrunculin-treated preparations following stimulation. C, an electron micrograph of a latrunculin-treated preparation. Again, arrows indicate morphological abnormalities. In all cases (A, B and C) the ultrastructure is altered compared to resting terminals. In controls this was predominantly seen as a loss of vesicles and the appearance of endocytic intermediates (cisternae). In both wortmannin-treated and latrunculin-treated preparations, in addition to the loss of vesicles, complex membrane structures were often evident. Scale bar = 100 nm D, quantification of numbers of vesicles plotted against distance from the active zone. No significant difference was seen between treatments. Control distribution is plotted again from Fig. 5B for purposes of comparison. E, total number of vesicles seen in terminals for each treatment. F, ‘empty space’ seen in nerve terminals (open sections of bars) and complex membrane regions (hatched sections of bars). The failure of wortmannin- and latrunculin-treated preparations to match the increase in empty space seen in control preparations (P < 0.01) is explained if one considers the area occupied by the complex membrane regions. As in Fig. 5, data plotted in panels B–D are mean values obtained from >20 terminals, from 5 preparations each.
Figure 7
Figure 7. Latrunculin and wortmannin effects were not reversible
A, a representative electron micrograph showing a nerve terminal which has recovered from stimulation, revealing ultrastructure which is indistinguishable from an unstimulated preparation. B, wortmannin-treated preparations which have been stimulated no longer recover. Multilaminar membrane structures, similar to those seen in treated preparations immediately following stimulation (arrows), persist even 15 min after the end of stimulation. C, similarly to wortmannin-treated preparations, those treated with latrunculin A also fail to recover within 15 min of stimulation. Again, arrows indicate abnormal membraneous structures. Scale bar = 100 nm. D, quantification of numbers of vesicles plotted against distance from the active zone. Control preparations showed full recovery to unstimulated values, whereas treated preparations showed no recovery (P < 0.001). E, total number of vesicles seen in terminals for each treatment. F, ‘empty space’ in nerve terminals (open sections of bars) and complex membrane regions (hatched sections of bars). The wortmannin- and latrunculin-treated preparations retain the complex membrane regions. Controls have recovered to normal. Again, data plotted in panels B–D are mean values obtained from >20 terminals, from 5 preparations each.
Figure 8
Figure 8. Summary cartoon
Two pathways of endocytosis in nerve terminals are illustrated. Our results are explained by a model in which rapid recycling is unaffected by either latrunculin A or wortmannin, but the slow route of endocytosis is blocked by both drugs. Latrunculin A also impairs release by interfering with vesicle mobilization.

Similar articles

Cited by

References

    1. Aravanis AM, Pyle JL, Tsien RW. Single synaptic vesicles fusing transiently and successively without loss of identity. Nature. 2003;423:643–647. - PubMed
    1. Arcaro A, Wymann MP. Wortmannin is a potent phosphatidylinositol 3-kinase inhibitor: the role of phosphatidylinositol 3,4,5-trisphosphate in neutrophil responses. Biochem J. 1993;296:297–301. - PMC - PubMed
    1. Bai J, Tucker WC, Chapman ER. PIP2 increases the speed of response of synaptotagmin and steers its membrane-penetration activity toward the plasma membrane. Nature Struct Mol Biol. 2004;11:36–44. - PubMed
    1. Betz WJ, Bewick GS. Optical analysis of synaptic vesicle recycling at the frog neuromuscular junction. Science. 1992;225:200–203. - PubMed
    1. Brodin L, Low P, Shupliakov O. Sequential steps in clathrin-mediated synaptic vesicle endocytosis. Curr Opin Neurobiol. 2000;10:312–320. - PubMed

Publication types

MeSH terms

LinkOut - more resources