. 2004;6(2):R92-109.
doi: 10.1186/bcr754. Epub 2003 Dec 18.

Gene expression profiling of mammary gland development reveals putative roles for death receptors and immune mediators in post-lactational regression

Affiliations

Gene expression profiling of mammary gland development reveals putative roles for death receptors and immune mediators in post-lactational regression

Richard W E Clarkson et al. Breast Cancer Res. 2004.

Abstract

Introduction: In order to gain a better understanding of the molecular processes that underlie apoptosis and tissue regression in mammary gland, we undertook a large-scale analysis of transcriptional changes during the mouse mammary pregnancy cycle, with emphasis on the transition from lactation to involution.

Method: Affymetrix microarrays, representing 8618 genes, were used to compare mammary tissue from 12 time points (one virgin, three gestation, three lactation and five involution stages). Six animals were used for each time point. Common patterns of gene expression across all time points were identified and related to biological function.

Results: The majority of significantly induced genes in involution were also differentially regulated at earlier stages in the pregnancy cycle. This included a marked increase in inflammatory mediators during involution and at parturition, which correlated with leukaemia inhibitory factor-Stat3 (signal transducer and activator of signalling-3) signalling. Before involution, expected increases in cell proliferation, biosynthesis and metabolism-related genes were observed. During involution, the first 24 hours after weaning was characterized by a transient increase in expression of components of the death receptor pathways of apoptosis, inflammatory cytokines and acute phase response genes. After 24 hours, regulators of intrinsic apoptosis were induced in conjunction with markers of phagocyte activity, matrix proteases, suppressors of neutrophils and soluble components of specific and innate immunity.

Conclusion: We provide a resource of mouse mammary gene expression data for download or online analysis. Here we highlight the sequential induction of distinct apoptosis pathways in involution and the stimulation of immunomodulatory signals, which probably suppress the potentially damaging effects of a cellular inflammatory response while maintaining an appropriate antimicrobial and phagocytic environment.


Figures
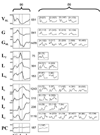
Figure 1
Figure 1
Clusters of gene expression profiles from a 12-point time course of adult mammary gland development. Thirty-five K means clusters were obtained from 6796 differentially expressed genes across a 12-point time course of the adult mammary gland pregnancy cycle. In order to identify basic trends in expression, these clusters were arbitrarily organized into groups based on the similarity between their mean profiles (b). These clusters were pooled and displayed as combined average expression profiles (a). (a) Combined expression profiles named according to developmental stage exhibiting maximal expression (capital) and their associated expression pattern (subscript). VSL, virgin and suppressed lactation; G, gestation; GSL, gestation and suppressed lactation; LT, lactation, transient; L, lactation; LG, lactation and gestation; IL, involution and lactation; IT, involution, transient; IP, involution and parturition; IG, involution and gestation; PC, postcoitum. Y axis is the mean normalized signal intensity. Dotted lines indicate boundaries between major phases of development: virgin to gestation; parturition; and 10-day lactation (forced weaning). Total number of genes in each combined cluster shown to the right. (b)Thirty-five K-means clusters. Total number of genes (brackets) and the ID for each cluster is shown. Each differentially expressed transcript is represented only once in the 35 clusters. Error bars represent standard error of the mean. X axis is the 12 developmental time points used in microarray analysis: v, virgin (8 week); G, gestation (days 5, 10 and 15 postcoitum); L, lactation (days 0, 5 and 10 postpartum); I, involution (days 0.5, 1, 2, 3 and 4 after forced weaning).
Figure 2
Figure 2
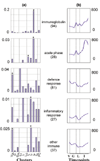
Relative expression of immune related genes in the 12 point timecourse of mammary development. Immune-related transcripts differentially expressed in the 12-point developmental time course were grouped into five categories that represent different immunological functions. The number of transcripts in each category is shown in brackets. Genelists of all transcripts assigned to these immunological categories are available online. (a) The frequency of transcripts in each expression profile cluster for each immunological category. Statistically significant associations, as determined by Onto-Express, are indicated with asterisks. Y axes indicate the percentage for each cluster. X axis indicates the combined expression profile clusters. (b) The mean expression profiles for all transcripts in each immunological category. Y axis indicates the mean normalized signal intensity, and the X axis indicates the 12 developmental time points (see Fig. 1).
Figure 3
Figure 3
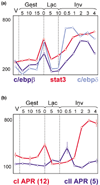
Mean expression profiles of acute phase genes. (a) Expression profile of the signal transducer and activator of transcription (Stat)3 transcript (red), as compared with CAAT-enhancer binding protein (c/ebp)β (dark blue) and c/ebpδ (light blue) from the microarray. (b) The mean expression profiles of 12 class I acute phase response genes (cI APR; red) and five class II acute phase response genes (cII APR; blue). Y axes indicate mean normalized intensity, and X axes indicate the developmental time points in days. Error bars represent standard error of the mean. Gest, gestation; Lac, Lactation; Inv, involution.
Figure 4
Figure 4
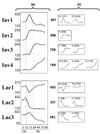
Clusters of gene expression profiles from a seven-point time course of mammary lactation and involution. Fifteen K means clusters of 4103 differentially expressed transcripts from seven stages of lactation and involution. Fourteen primary clusters (b) were grouped according to similarity into (a) seven basic profiles: Inv1, Inv2, Inv3, Inv4, Lac1, Lac2 and Lac3. These similar clusters were pooled and plotted as seven combined expression profiles. The 15th cluster represented differential expression between 5-day and 10-day lactation only (not shown). The number of genes for each pooled cluster is indicated to the right of panel A. The number of genes (brackets) and the cluster ID is indicated for each primary cluster in panel B. Each differentially expressed transcript is represented only once in the 15 primary clusters. The number of genes in each combined profile (panel A) is the sum of its primary profiles (panel B). Y-axis is the mean of normalized intensities. Error bars represent the standard error of the mean for all transcripts in each cluster. X axis = 7 point timecourse across lactation (Lac) and involution (Inv). Dotted lines highlight 10 day lactation and 24 hour involution timepoints.
Figure 5
Figure 5
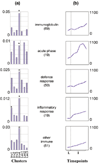
Relative expression of immune related genes in the seven-point time course of mammary lactation and involution. Immune-related transcripts that were differentially expressed in the seven-point lactation/involution time course were grouped into five categories representing different immunological functions. The number of transcripts in each category is shown in brackets. Genelists of all transcripts assigned to these immunological categories are available online. (a) For each category, the frequency of transcripts in each expression profile cluster was plotted. Statistically significant associations, as determined by Onto-Express, are indicated with asterisks. The Y axis indicates the percentage of each expression profile cluster, and the X axis indicates the expression profile cluster. (b) The mean combined expression profiles of transcripts in each immunological category are also shown (right). The Y axis indicates the mean normalized signal intensity, and the X axis indicates the seven developmental timepoints from lactation (L) and involution (I; see Fig. 2).
Figure 6
Figure 6
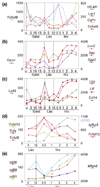
Involution related expression profiles: apoptosis and immune related genes. (a) Expression profiles of differentially expressed immune cell antigens, illustrating the relative proportions of immune cell subtypes in mammary gland during the complete pregnancy cycle. Monocyte/macrophage markers: Lrp1 = Cd91; Csf1r = Cd115. Lymphocyte markers: Tnfrsf9 = Cd137; H2-M1 = Mb1; Tnfrsf4 = OX40. (b) Profiles of differentially expressed anti-inflammatory factors in the complete mammary time course. (c) Profiles of differentially expressed soluble defence factors, including the innate components lactoferrin (Ltf), Cd14, Ly86 and Lbp. Also shown is the mean expression profile for all differentially expressed immunoglobulin transcripts. (d) Differentially expressed death receptor ligands (Tnfsf6 = FasL, Tnfsf12 = Tweak, TNFa and Tnfsf10 = Trail) and the insulin-like growth factor (IGF) inhibitor Igfbp5. (e) Differentially expressed receptors and ligands involved in recognition and engulfment of apoptotic cells. Y axes indicate the normalized intensity. (Note that the brackets in panel d represent scale for Igfbp5 only.) X axes indicate developmental time points for the complete 12-point time course (panels a, b and c) and 7-point lactation/involution time course (d, e).

Comment in

  • Evolving views of involution.
    Master SR, Chodosh LA. Master SR, et al. Breast Cancer Res. 2004;6(2):89-92. doi: 10.1186/bcr765. Epub 2004 Feb 10. Breast Cancer Res. 2004. PMID: 14979913 Free PMC article. Review.

Similar articles

Cited by

References

    1. Visvader JE, Lindeman GJ. Transcriptional regulators in mammary gland development and cancer. Int J Biochem Cell Biol. 2003;35:1034–1051. doi: 10.1016/S1357-2725(03)00030-X. - DOI - PubMed
    1. Lund LR, Romer J, Thomasset N, Solberg H, Pyke C, Bissell MJ, Dano K, Werb Z. Two distinct phases of apoptosis in mammary gland involution: proteinase-independent and -dependent pathways. Development. 1996;122:181–193. - PMC - PubMed
    1. Alexander CM, Selvarajan S, Mudgett J, Werb Z. Stromelysin-1 regulates adipogenesis during mammary gland involution. J Cell Biol. 2001;152:693–703. doi: 10.1083/jcb.152.4.693. - DOI - PMC - PubMed
    1. Li M, Liu X, Robinson G, Bar-Peled U, Wagner KU, Young WS, Hennighausen L, Furth PA. Mammary-derived signals activate programmed cell death during the first stage of mammary gland involution. Proc Natl Acad Sci USA. 1997;94:3425–3430. doi: 10.1073/pnas.94.7.3425. - DOI - PMC - PubMed
    1. Strange R, Li F, Saurer S, Burkhardt A, Friis RR. Apoptotic cell death and tissue remodelling during mouse mammary gland involution. Development. 1992;115:49–58. - PubMed

Publication types

MeSH terms

LinkOut - more resources