

Genomewide scan in families with schizophrenia from the founder population of Afrikaners reveals evidence for linkage and uniparental disomy on chromosome 1
- PMID: 14750073
- PMCID: PMC1182255
- DOI: 10.1086/381713
Genomewide scan in families with schizophrenia from the founder population of Afrikaners reveals evidence for linkage and uniparental disomy on chromosome 1
Abstract
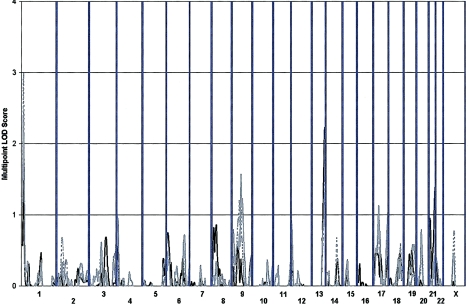
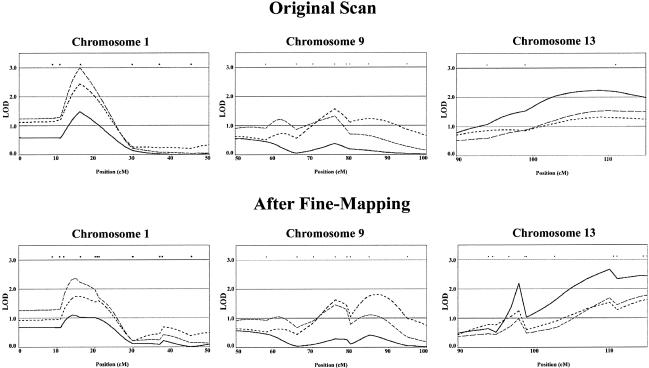
We report on our initial genetic linkage studies of schizophrenia in the genetically isolated population of the Afrikaners from South Africa. A 10-cM genomewide scan was performed on 143 small families, 34 of which were informative for linkage. Using both nonparametric and parametric linkage analyses, we obtained evidence for a small number of disease loci on chromosomes 1, 9, and 13. These results suggest that few genes of substantial effect exist for schizophrenia in the Afrikaner population, consistent with our previous genealogical tracing studies. The locus on chromosome 1 reached genomewide significance levels (nonparametric LOD score of 3.30 at marker D1S1612, corresponding to an empirical P value of.012) and represents a novel susceptibility locus for schizophrenia. In addition to providing evidence for linkage for chromosome 1, we also identified a proband with a uniparental disomy (UPD) of the entire chromosome 1. This is the first time a UPD has been described in a patient with schizophrenia, lending further support to involvement of chromosome 1 in schizophrenia susceptibility in the Afrikaners.
Figures


Similar articles
-
A genomewide scan for loci predisposing to type 2 diabetes in a U.K. population (the Diabetes UK Warren 2 Repository): analysis of 573 pedigrees provides independent replication of a susceptibility locus on chromosome 1q.Am J Hum Genet. 2001 Sep;69(3):553-69. doi: 10.1086/323249. Epub 2001 Aug 1. Am J Hum Genet. 2001. PMID: 11484155 Free PMC article.
-
Genomewide linkage scan of 409 European-ancestry and African American families with schizophrenia: suggestive evidence of linkage at 8p23.3-p21.2 and 11p13.1-q14.1 in the combined sample.Am J Hum Genet. 2006 Feb;78(2):315-33. doi: 10.1086/500272. Epub 2006 Jan 3. Am J Hum Genet. 2006. PMID: 16400611 Free PMC article.
-
Genomewide linkage scan for schizophrenia susceptibility loci among Ashkenazi Jewish families shows evidence of linkage on chromosome 10q22.Am J Hum Genet. 2003 Sep;73(3):601-11. doi: 10.1086/378158. Epub 2003 Aug 15. Am J Hum Genet. 2003. PMID: 12929083 Free PMC article.
-
Clinical characteristics of an Afrikaner founder population recruited for a schizophrenia genetic study.Ann N Y Acad Sci. 2009 Jan;1151:85-101. doi: 10.1111/j.1749-6632.2008.03453.x. Ann N Y Acad Sci. 2009. PMID: 19154519 Review.
-
Linkage studies of schizophrenia.Neurotox Res. 2004;6(1):17-34. doi: 10.1007/BF03033293. Neurotox Res. 2004. PMID: 15184102 Review.
Cited by
-
Novel susceptibility locus at 22q11 for diabetic nephropathy in type 1 diabetes.PLoS One. 2011;6(9):e24053. doi: 10.1371/journal.pone.0024053. Epub 2011 Sep 1. PLoS One. 2011. PMID: 21909410 Free PMC article.
-
Chromosome 13q13-q14 locus overlaps mood and psychotic disorders: the relevance for redefining phenotype.Eur J Hum Genet. 2009 Aug;17(8):1034-42. doi: 10.1038/ejhg.2008.268. Epub 2009 Jan 28. Eur J Hum Genet. 2009. PMID: 19172987 Free PMC article.
-
Correspondence between fMRI and SNP data by group sparse canonical correlation analysis.Med Image Anal. 2014 Aug;18(6):891-902. doi: 10.1016/j.media.2013.10.010. Epub 2013 Oct 31. Med Image Anal. 2014. PMID: 24247004 Free PMC article.
-
Heritability and genome-wide linkage in US and australian twins identify novel genomic regions controlling chromogranin a: implications for secretion and blood pressure.Circulation. 2008 Jul 15;118(3):247-57. doi: 10.1161/CIRCULATIONAHA.107.709105. Epub 2008 Jun 30. Circulation. 2008. PMID: 18591442 Free PMC article.
-
LRRTM1 on chromosome 2p12 is a maternally suppressed gene that is associated paternally with handedness and schizophrenia.Mol Psychiatry. 2007 Dec;12(12):1129-39, 1057. doi: 10.1038/sj.mp.4002053. Epub 2007 Jul 31. Mol Psychiatry. 2007. PMID: 17667961 Free PMC article.
References
Electronic-Database Information
-
- Authors' Web site, http://www.sph.umich.edu/csg/abecasis/public/ (for results of parametric linkage analyses)
-
- Center for Medical Genetics, Marshfield Clinic, http://research.marshfieldclinic.org/genetics/ (for the Marshfield genetic map)
-
- CIDR Human Marker Set, http://www.cidr.jhmi.edu/markerset.html (for marker screening set)
-
- Online Mendelian Inheritance in Man (OMIM), http://www.ncbi.nlm.nih.gov/Omim/ (for schizophrenia)
References
-
- Abecasis GR, Cherny SS, Cardon LR (2001a) The impact of genotyping error on family-based analysis of quantitative traits. Eur J Hum Genet 9:130–134 - PubMed
-
- American Psychiatric Association (1994) DSM-IV: diagnostic and statistical manual of mental disorders, 4th ed. American Psychiatric Association, Washington, DC
Publication types
MeSH terms
Grants and funding
LinkOut - more resources
Full Text Sources
Other Literature Sources
Medical
