

A store-operated calcium channel in Drosophila S2 cells
- PMID: 14744989
- PMCID: PMC2217434
- DOI: 10.1085/jgp.200308982
A store-operated calcium channel in Drosophila S2 cells
Abstract
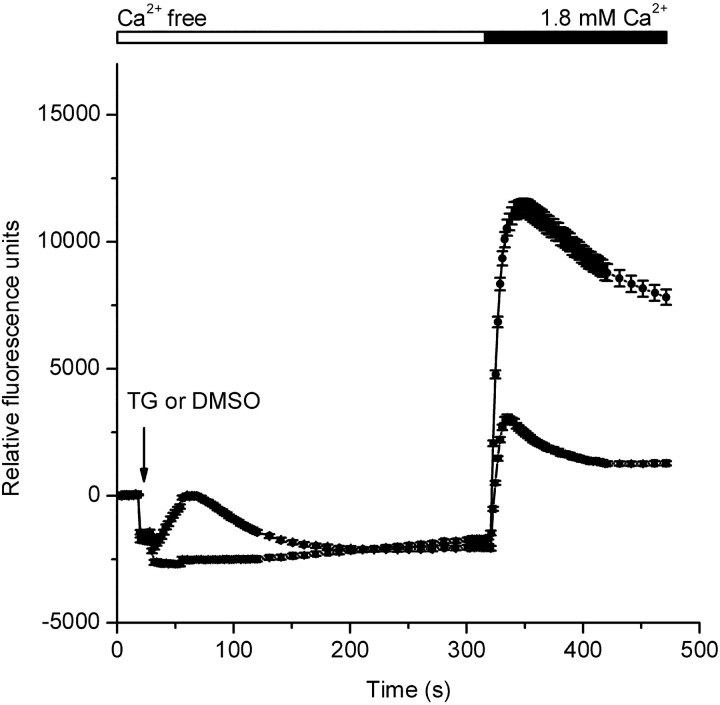
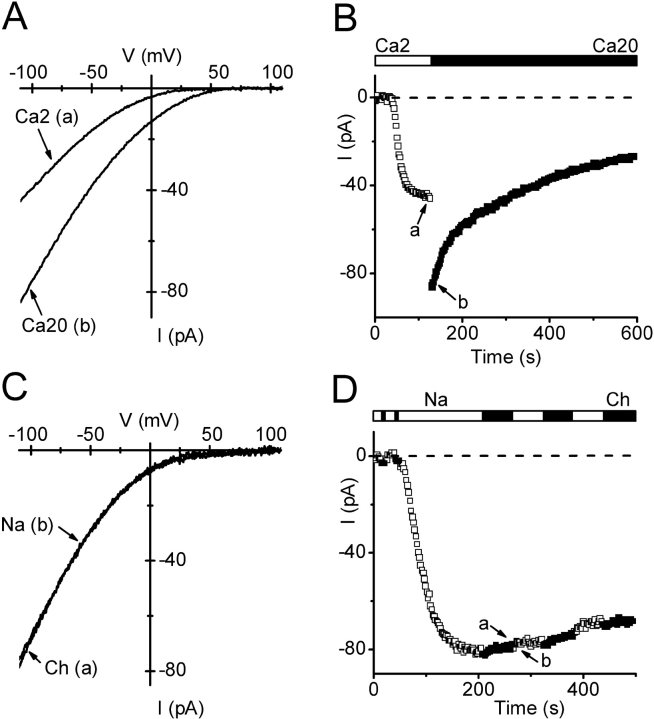
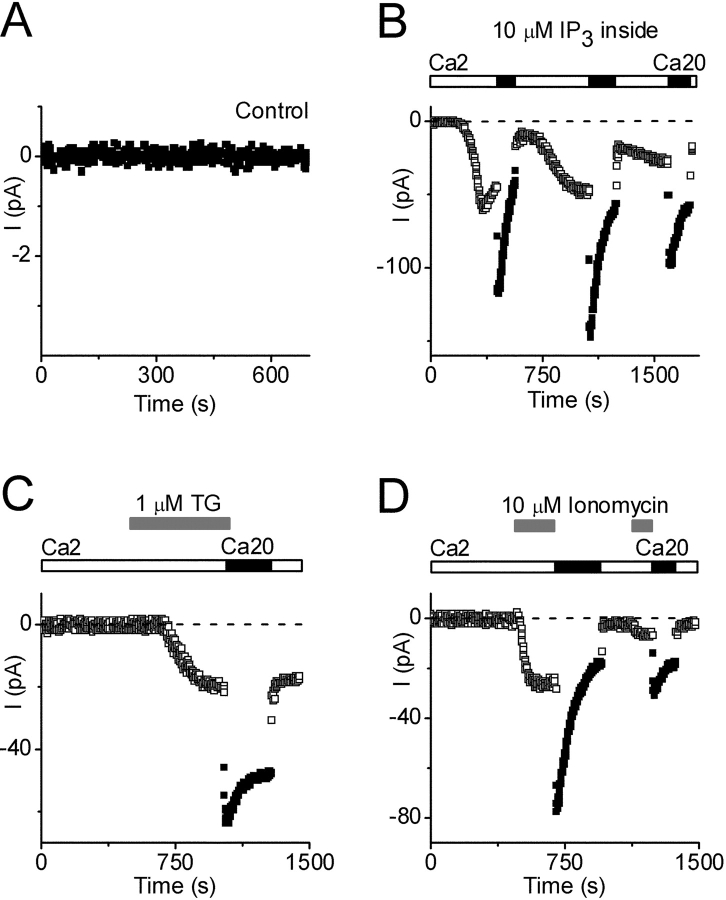
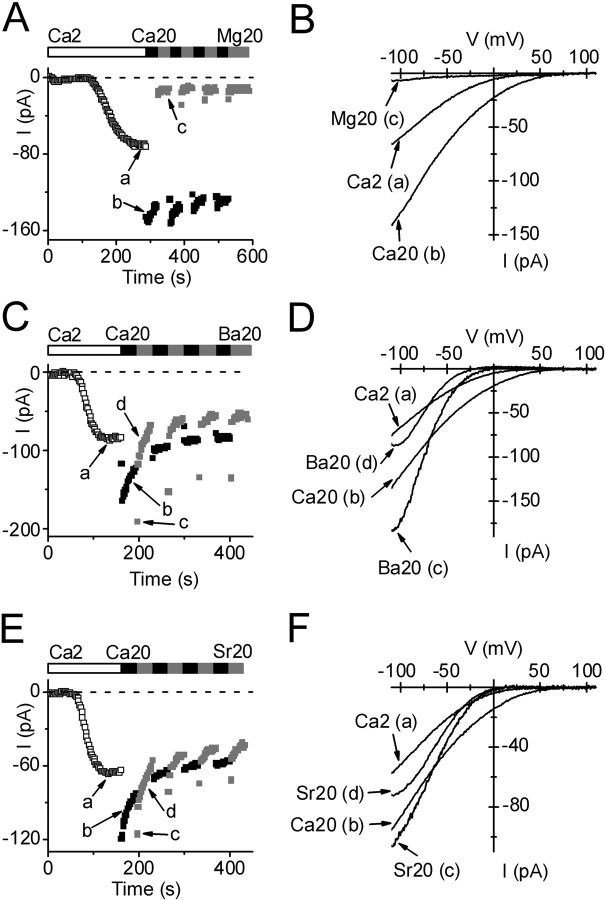
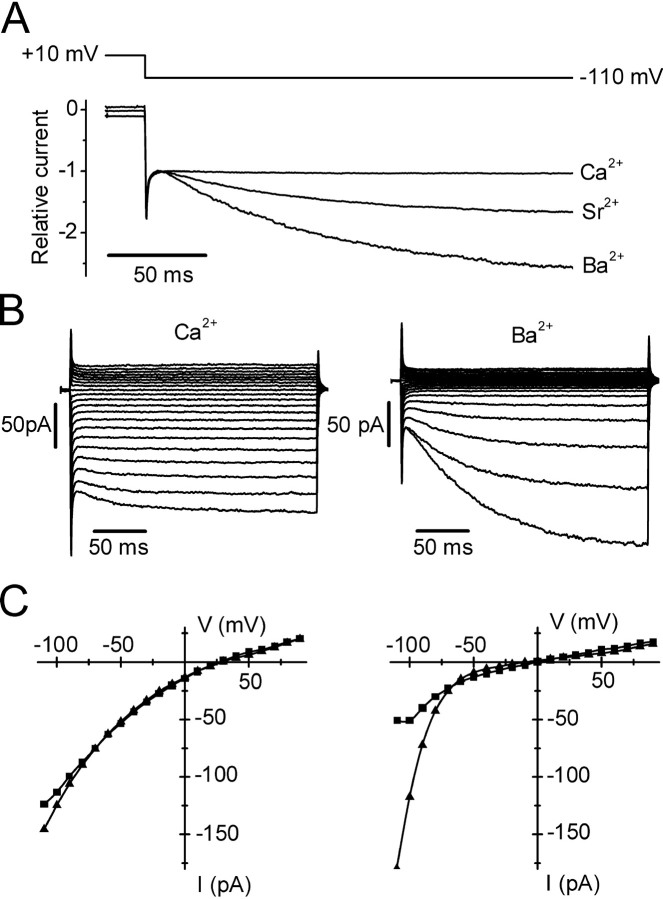
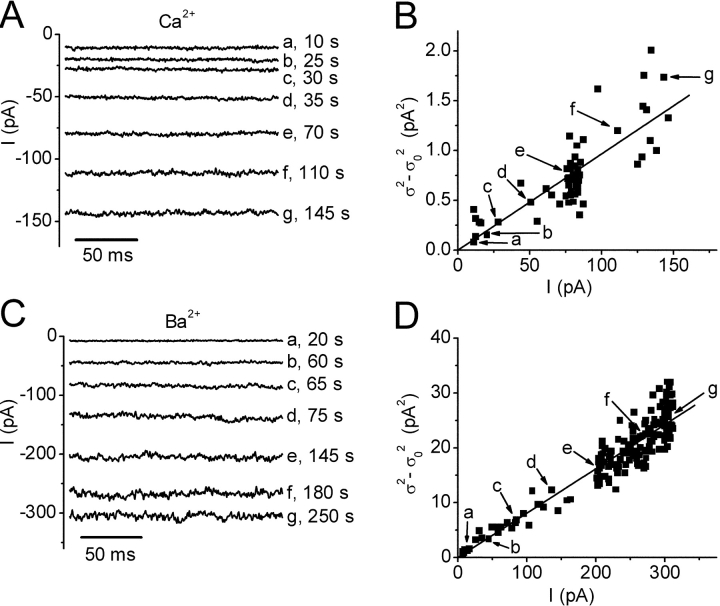
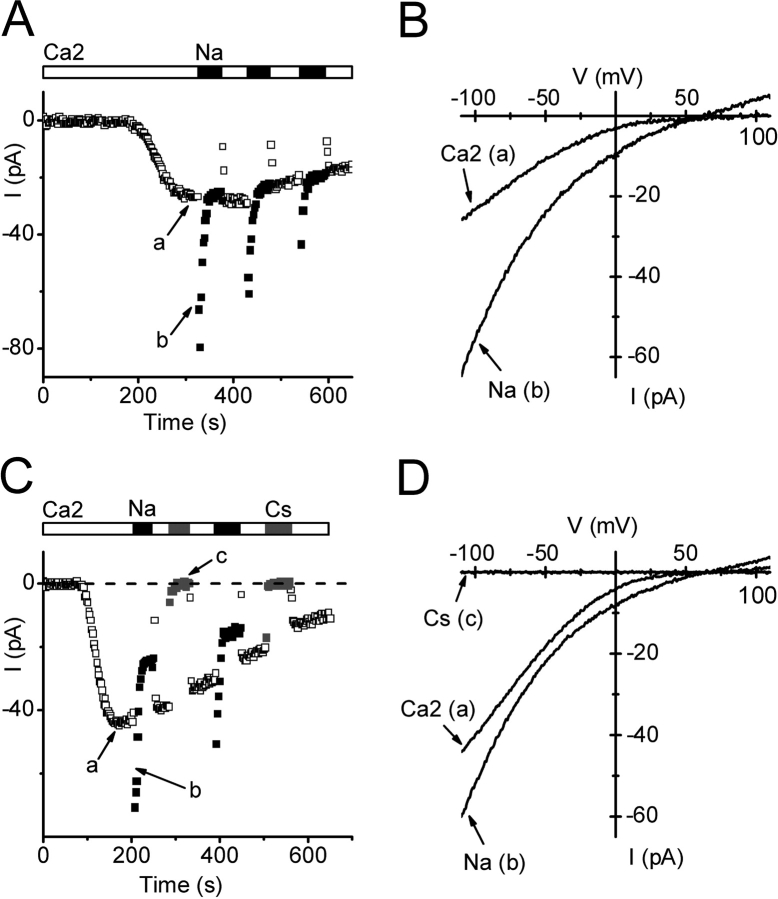
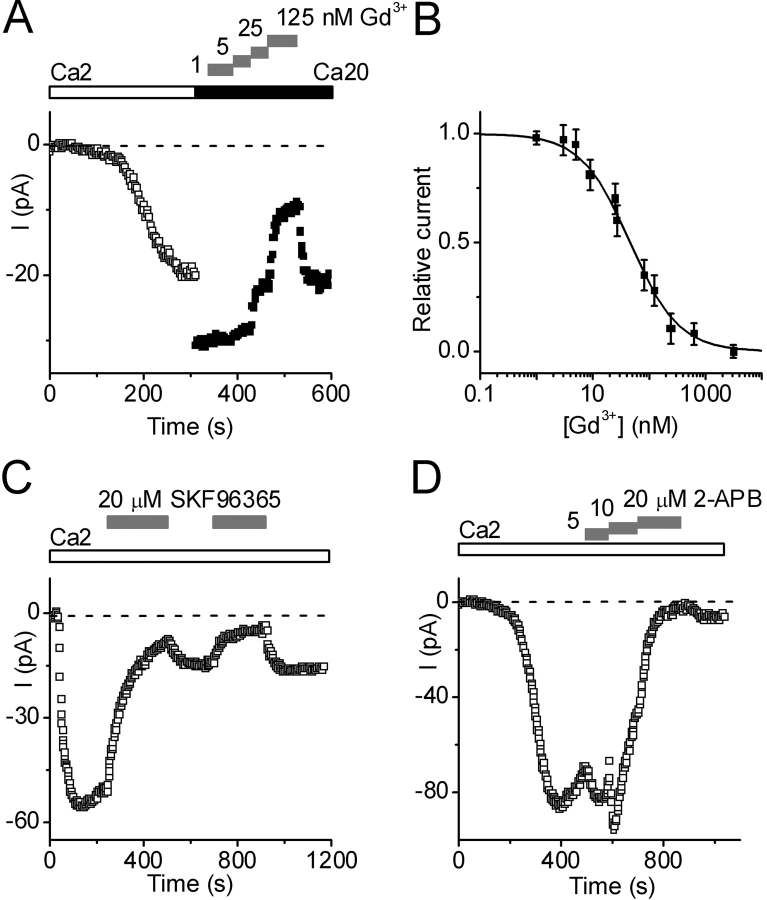
Using whole-cell recording in Drosophila S2 cells, we characterized a Ca(2+)-selective current that is activated by depletion of intracellular Ca2+ stores. Passive store depletion with a Ca(2+)-free pipette solution containing 12 mM BAPTA activated an inwardly rectifying Ca2+ current with a reversal potential >60 mV. Inward currents developed with a delay and reached a maximum of 20-50 pA at -110 mV. This current doubled in amplitude upon increasing external Ca2+ from 2 to 20 mM and was not affected by substitution of choline for Na+. A pipette solution containing approximately 300 nM free Ca2+ and 10 mM EGTA prevented spontaneous activation, but Ca2+ current activated promptly upon application of ionomycin or thapsigargin, or during dialysis with IP3. Isotonic substitution of 20 mM Ca2+ by test divalent cations revealed a selectivity sequence of Ba2+ > Sr2+ > Ca2+ >> Mg2+. Ba2+ and Sr2+ currents inactivated within seconds of exposure to zero-Ca2+ solution at a holding potential of 10 mV. Inactivation of Ba2+ and Sr2+ currents showed recovery during strong hyperpolarizing pulses. Noise analysis provided an estimate of unitary conductance values in 20 mM Ca2+ and Ba2+ of 36 and 420 fS, respectively. Upon removal of all external divalent ions, a transient monovalent current exhibited strong selectivity for Na+ over Cs+. The Ca2+ current was completely and reversibly blocked by Gd3+, with an IC50 value of approximately 50 nM, and was also blocked by 20 microM SKF 96365 and by 20 microM 2-APB. At concentrations between 5 and 14 microM, application of 2-APB increased the magnitude of Ca2+ currents. We conclude that S2 cells express store-operated Ca2+ channels with many of the same biophysical characteristics as CRAC channels in mammalian cells.
Figures
Similar articles
-
Identification of store-independent and store-operated Ca2+ conductances in Caenorhabditis elegans intestinal epithelial cells.J Gen Physiol. 2003 Aug;122(2):207-23. doi: 10.1085/jgp.200308804. Epub 2003 Jul 14. J Gen Physiol. 2003. PMID: 12860924 Free PMC article.
-
Excitation of Drosophila photoreceptors by BAPTA and ionomycin: evidence for capacitative Ca2+ entry?Cell Calcium. 1996 Oct;20(4):315-27. doi: 10.1016/s0143-4160(96)90037-8. Cell Calcium. 1996. PMID: 8939351
-
Calcium-dependent potentiation of store-operated calcium channels in T lymphocytes.J Gen Physiol. 1996 May;107(5):597-610. doi: 10.1085/jgp.107.5.597. J Gen Physiol. 1996. PMID: 8740373 Free PMC article.
-
Permeation through store-operated CRAC channels in divalent-free solution: potential problems and implications for putative CRAC channel genes.Cell Calcium. 2002 Nov-Dec;32(5-6):379-91. doi: 10.1016/s0143416002001914. Cell Calcium. 2002. PMID: 12543097 Review.
-
On the endothelial cell I(SOC).Cell Calcium. 2003 May-Jun;33(5-6):323-36. doi: 10.1016/s0143-4160(03)00046-0. Cell Calcium. 2003. PMID: 12765679 Review.
Cited by
-
Highly Ca2+-selective TRPM channels regulate IP3-dependent oscillatory Ca2+ signaling in the C. elegans intestine.J Gen Physiol. 2008 Mar;131(3):245-55. doi: 10.1085/jgp.200709914. J Gen Physiol. 2008. PMID: 18299395 Free PMC article.
-
Neuronal Store-Operated Calcium Channels.Mol Neurobiol. 2023 Aug;60(8):4517-4546. doi: 10.1007/s12035-023-03352-5. Epub 2023 Apr 28. Mol Neurobiol. 2023. PMID: 37118324 Review.
-
The STIM1-ORAI1 microdomain.Cell Calcium. 2015 Oct;58(4):357-67. doi: 10.1016/j.ceca.2015.07.001. Epub 2015 Jul 17. Cell Calcium. 2015. PMID: 26215475 Free PMC article. Review.
-
STIM1 signalling controls store-operated calcium entry required for development and contractile function in skeletal muscle.Nat Cell Biol. 2008 Jun;10(6):688-97. doi: 10.1038/ncb1731. Epub 2008 May 18. Nat Cell Biol. 2008. PMID: 18488020 Free PMC article.
-
Molecular identification of the CRAC channel by altered ion selectivity in a mutant of Orai.Nature. 2006 Sep 14;443(7108):226-9. doi: 10.1038/nature05108. Epub 2006 Aug 20. Nature. 2006. PMID: 16921385 Free PMC article.
References
-
- Bakowski, D., and A.B. Parekh. 2002. Monovalent cation permeability and Ca2+ block of the store-operated Ca2+ current ICRAC in rat basophilic leukemia cells. Pflugers Arch. 443:892–902. - PubMed
-
- Christian, E.P., K.T. Spence, J.A. Togo, P.G. Dargis, and J. Patel. 1996. Calcium-dependent enhancement of depletion-activated calcium current in Jurkat T lymphocytes. J. Membr. Biol. 150:63–71. - PubMed
-
- Cordova, D., V.R. Delpech, D.B. Sattelle, and J.J. Rauh. 2003. Spatiotemporal calcium signaling in a Drosophila melanogaster cell line stably expressing a Drosophila muscarinic acetylcholine receptor. Invert Neurosci. 5:19–28 - PubMed
Publication types
MeSH terms
Substances
Grants and funding
LinkOut - more resources
Full Text Sources
Other Literature Sources
Molecular Biology Databases
Miscellaneous
