. 2004 Jan;123(1):21-32.
doi: 10.1085/jgp.200308916. Epub 2003 Dec 15.

S4 movement in a mammalian HCN channel

Affiliations

S4 movement in a mammalian HCN channel

Sriharsha Vemana et al. J Gen Physiol. 2004 Jan.

Abstract

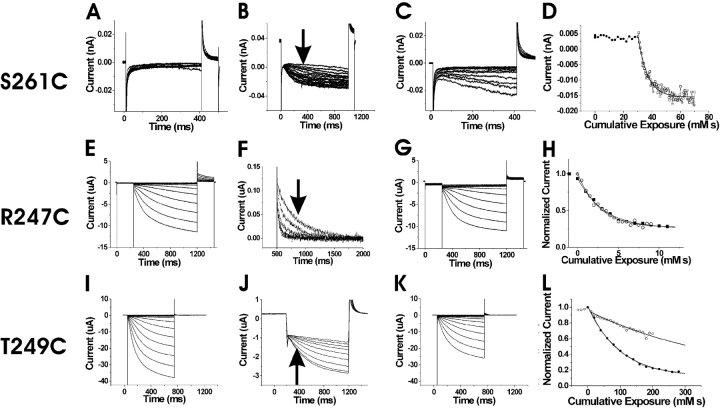
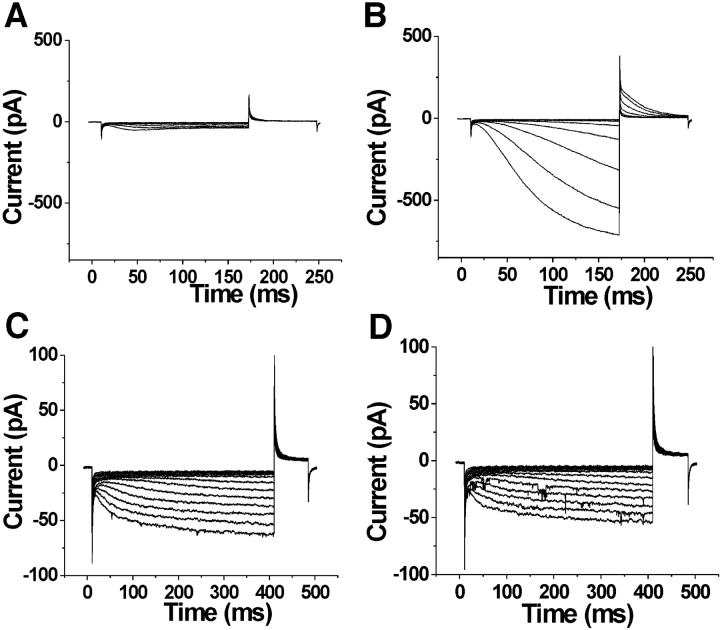
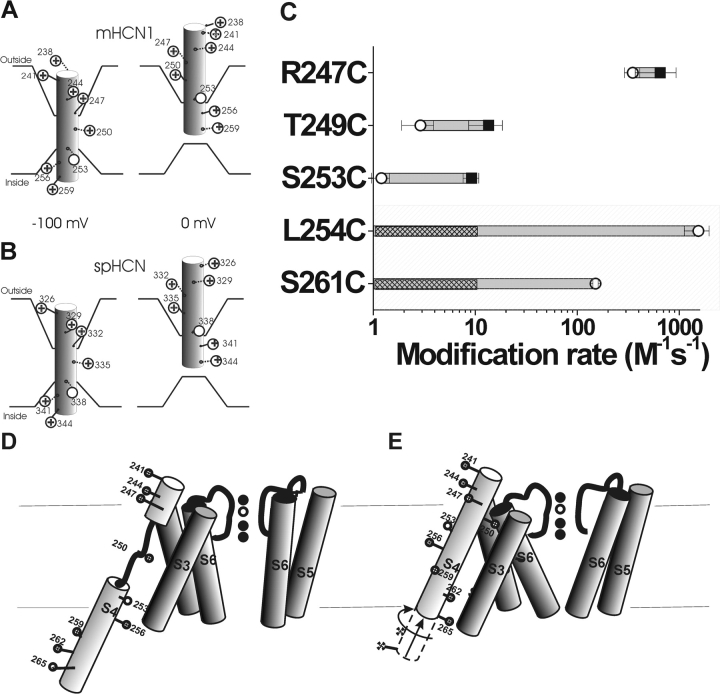
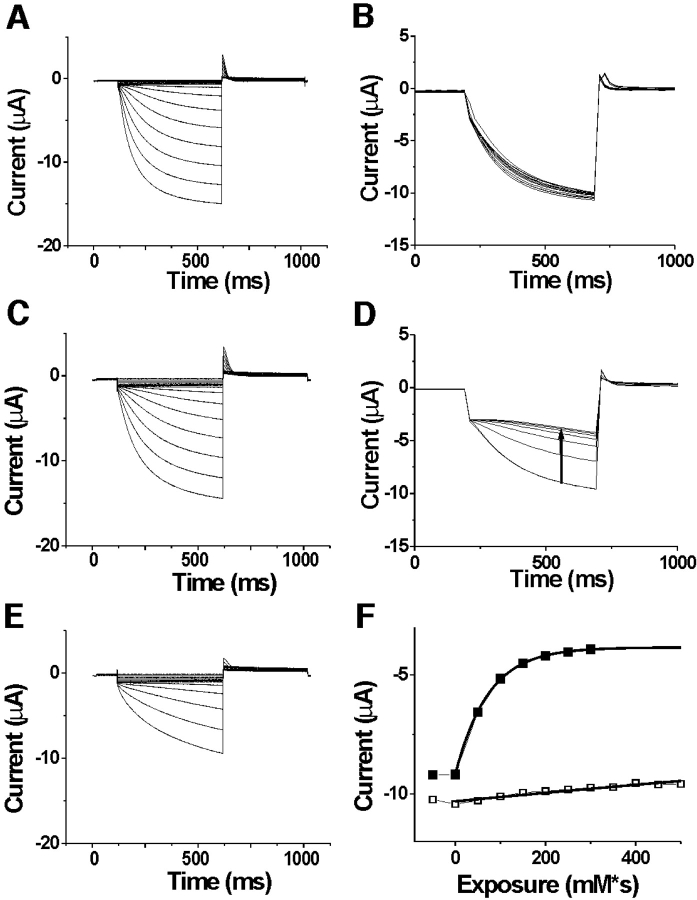
Hyperpolarization-activated, cyclic nucleotide-gated ion channels (HCN) mediate an inward cation current that contributes to spontaneous rhythmic firing activity in the heart and the brain. HCN channels share sequence homology with depolarization-activated Kv channels, including six transmembrane domains and a positively charged S4 segment. S4 has been shown to function as the voltage sensor and to undergo a voltage-dependent movement in the Shaker K+ channel (a Kv channel) and in the spHCN channel (an HCN channel from sea urchin). However, it is still unknown whether S4 undergoes a similar movement in mammalian HCN channels. In this study, we used cysteine accessibility to determine whether there is voltage-dependent S4 movement in a mammalian HCN1 channel. Six cysteine mutations (R247C, T249C, I251C, S253C, L254C, and S261C) were used to assess S4 movement of the heterologously expressed HCN1 channel in Xenopus oocytes. We found a state-dependent accessibility for four S4 residues: T249C and S253C from the extracellular solution, and L254C and S261C from the internal solution. We conclude that S4 moves in a voltage-dependent manner in HCN1 channels, similar to its movement in the spHCN channel. This S4 movement suggests that the role of S4 as a voltage sensor is conserved in HCN channels. In addition, to determine the reason for the different cAMP modulation and the different voltage range of activation in spHCN channels compared with HCN1 channels, we constructed a COOH-terminal-deleted spHCN. This channel appeared to be similar to a COOH-terminal-deleted HCN1 channel, suggesting that the main functional differences between spHCN and HCN1 channels are due to differences in their COOH termini or in the interaction between the COOH terminus and the rest of the channel protein in spHCN channels compared with HCN1 channels.


Figures

F<sc>igure</sc> 1.
Figure 1.
Stability of MTSET at room temperature and on ice. (A) Absorbance at 412 nm of 100 μM TNB dissolved in the 100-K solution containing different concentrations (0–100 μM) of MTSET. (B) A plot comparing the stability of MTSET over time in different solutions and at different temperatures. (▪) MTSET in 100-K solution on ice, τ = 1420 ± 312 min; (○) MTSET in dH2O on ice, τ = 4113 ± 3000 min; (▴) MTSET in 100-K solution at room temperature, τ = 111 ± 8 min; and (⋄) MTSET in NP100 solution at room temperature, τ = 19.4 ± 6.6 min.
F<sc>igure</sc> 2.
Figure 2.
Membrane topology and sequence alignment of HCN1 channels. (A) Above, membrane topology of the HCN1 channel, including six transmembrane domains (S1–S6), the cyclic-nucleotide binding site (CNBD), and the GYG K+ selectivity sequence in the pore domain. Below, a sequence alignment between the S4 region of the HCN1, spHCN, and Shaker K+ channels (Gauss et al., 1998; Männikkö et al., 2002). The positively charged residues are in bold. The stars above the HCN1 channel note residues mutated into cysteines in this study. The arrows indicate mutations that expressed in oocytes: R247C, T249C, I251C, S253C, L254C, and S261C. (B) HCN1 currents elicited by voltage steps in −10 mV increments from 0 to −190 mV, from a holding potential of 0 mV, followed by a step to +50 mV for tail currents. (C) Representative G(V) curves from isochronal tails at +50 mV for the expressing mutations: (○) R247C: V1/2 = −102 ± 1 mV, slope = 12.7 ± 0.9 mV; (•) T249C: V1/2 = −118.6 ± 0.8 mV, slope = 13 ± 0.4 mV; (□) S253C: V1/2 = −48.8 ± 1.5 mV, slope = 19.5 ± 1.3 mV; (▪) L254C: V1/2 = −78.8 ± 0.6 mV, slope = 10.7 ± 0.5 mV; (▵) S261C: V1/2 = −135 ± 6 mV, slope = 22 ± 2 mV; and the background channel (×) C318S: V1/2 = −70.2 ± 0.6 mV, slope = 12.3 ± 0.6 mV.
F<sc>igure</sc> 3.
Figure 3.
State-dependent accessibility of S253C. Currents before (A), during (B), and after (C) the application of 100 μM extracellular MTSET. In A and C, the voltage steps are in −10-mV increments from 0 to −150 mV. In B, voltage was held at 0 mV and then stepped to −120 mV for the test pulse, followed by a step to +50 mV for tail currents. The holding potential was 0 mV. MTSET was applied for 10 s during each episode. (D) Currents measured at the arrow in B as a function of cumulative exposure to MTSET. The modification time course for the extracellular application of 100 μM MTSET at 0 mV (•) and at −100 mV (□). The bold lines are an exponential fit to the data.
F<sc>igure</sc> 4.
Figure 4.
State-dependent accessibility of L254C. (A–D) Application of MTSEA on the background channel HCN1 C318S. Currents before (A), during (B), and after (C), the intracellular application of MTSEA onto inside-out patches expressing HCN1 C318S mutants. In A and C the voltage steps occur in −10-mV increments from 0 to −120 mV. In B, the current trace is from a voltage step from 0 to −120 mV for 1 s during the application of 100 μM MTSEA. The voltage steps occurred every 2 s. (D) Currents measured at the arrow in B as a function of cumulative exposure to MTSEA. Modification rates for MTSEA at 0 mV (•) and at −120 mV (○). (E–H) State-dependent accessibility of L254C. Currents before (E), during (F), and after (G) the application of 100 μM intracellular MTSEA. In E and G, the voltage steps occur in 10-mV increments from −40 to −150 mV. In F, voltage was held at 0 mV and then stepped to −120 mV for the test pulse, followed by a step to +50 mV for tail currents. The holding potential was −120 mV. The patch was excised into a bath solution containing 100 μM MTSEA. (H) Currents measured at the arrow in F as a function of cumulative exposure to MTSEA. Modification time course for intracellular MTSEA at 0 mV (•) and −120 mV (□). The current amplitudes are plotted versus cumulative exposure to MTSEA and MTSET, in D and H, respectively. The bold line is an exponential fit to the data in H.
F<sc>igure</sc> 5.
Figure 5.
State-dependent accessibility of three S4 residues. (A–D) State-dependent accessibility of S261C. Currents before (A), during (B), and after (C) the intracellular application of 200 μM MTSEA. In (A) and (C), the voltage steps occur in –10 mV increments from −60 to −150 mV. In B, the voltage was held at 0 mV and then stepped to −140 mV for the test pulse, followed by a step to +50 mV for tail currents. The holding potential was 0 mV. The patch was excised into a bath containing 200 μM MTSEA. (D) Modification time course for intracellular MTSEA at 0 mV (•) and −140 mV (□). The current amplitudes are plotted versus their cumulative exposure to MTSEA. The bold line is an exponential fit. (E–G) State-independent accessibility of R247C. Currents before (E), during (F), and after (G) the extracellular application of 100 μM MTSET. In E and G, the voltage steps occur in −10-mV increments from 0 to −150 mV. In F, voltage was held at 0 mV and then stepped to −120 mV for the test pulse, followed by a step to 0 mV for tail currents. The tail currents during the application of 100 μM MTSET are shown in F. (H) Currents at the arrow in F as a function of cumulative exposure to MTSET. The modification time course for the extracellular application of MTSET at 0 mV (•) and at −100 mV (□). The bold lines are exponential fits to the data. (I–L) State-dependent accessibility of T249C. Currents before (I), during (J), and after (K) the application of 2 mM extracellular MTSET. In I and K, the voltage steps occur in −10-mV increments from 0 to −150 mV. In J, voltage was held at 0 mV and then stepped to −120 mV for the test pulse, followed by a step to +50 mV for tail currents. The holding potential was 0 mV. MTSET was applied for 10 s during each episode. (L) Currents at the arrow in J as a function of cumulative exposure to MTSET. Modification time course for the extracellular application of MTSET at 0 mV (•) and at −100 mV (□).
F<sc>igure</sc> 6.
Figure 6.
The COOH terminus is necessary for inactivation in spHCN channels. Currents in the absence of internal cAMP (A and C) or the presence of 100 μM cAMP (B and D) in inside-out patches expressing wt spHCN channels (A and B) and spHCNΔC-term channels (C and D). For the wt spHCN channels, voltage steps occurred in 10-mV increments from −10 to −120 mV, from a holding potential of −10 mV. Tails currents were at +50 mV. For the spHCN ΔC-term channels, voltage steps occurred in 10-mV increments from −10 to −160 mV, from a holding potential of −10 mV. Tail currents were at +50 mV. The effects of the truncation of the COOH terminus of spHCN channels are: (1) the removal of inactivation, (2) a shift in the voltage dependence by −25 mV (see text), and (3) a 10-fold reduction in the expression level. (Note that spHCN channels in the excised patches activated at 20–30-mV more negative potentials than in intact oocytes, Männikkö et al., 2002.).
F<sc>igure</sc> 7.
Figure 7.
A model of the voltage-dependent movements of S4 in the HCN1 channel (A) and the spHCN channel (B). (A) Based on results from this study, S4 is the voltage sensor in the HCN1 channel. HCN1 S4 is in an inward position at −100 mV, which opens the channel gate. Stepping the voltage to 0 mV results in the outward movement of S4 into the extracellular solution, causing the channel gate to close. This movement is similar to that described for the spHCN channel (Männikkö et al., 2002), seen in B. The intracellular border of S4 movement is not well-defined from our results. (C) Modification rates for cysteine mutants in the HCN1 channel in the open (○) and closed (▪) states. The shaded area represents residues tested for intracellular accessibility by excised patch recordings. The nonshaded area represents residues tested for extracellular accessibility by two-electrode voltage clamp. We did not see any modification resulting from the intracellular application of MTSEA at 0 mV; hence, we can only give an upper estimate of the modification rate for these residues. The hatch bars indicate the range of possible modification rates for these residues at 0 mV. (D and E) An alternative model for S4 movement in HCN1 channels. At hyperpolarized potentials (D), the S4 α helix unwinds external to the S253 as it moves inwards. At depolarized potentials (E), the lower portion of S4 moves outwards and S4 undergoes a conformational change into a continuous α helix.
F<sc>igure</sc> 8.
Figure 8.
Larger state-dependent modification of T249C at more hyperpolarized potentials. Currents before (A), during (B), and after (C) the application of 10 mM extracellular MTSET applied at −130 mV. Currents during (D) and after (E) the application of 10 mM extracellular MTSET applied at 0 mV on the same oocyte as in A to C. In A, C, and E, the voltage steps are in −10-mV increments from 0 to −140 mV. In B and D, the voltage was held at 0 mV and then stepped to −120 mV for the test pulse, followed by a step to +50 mV for tail currents. The holding potential was 0 mV. MTSET was applied for 5 s between each episode. (F) Currents measured at the arrow in D as a function of cumulative exposure to MTSET. The modification time course for extracellular application of MTSET at 0 mV (▪) and at −130 mV (□). The bold lines are an exponential fit to the data (for −130 mV, the I4 was constrained to the value found for the fit at 0 mV). τ = 3.5 M*s for −130 mV, and τ = 0.0727 M*s for 0 mV. Similar results were seen in four oocytes.

Similar articles

Cited by

References

    1. Aggarwal, S.K., and R. MacKinnon. 1996. Contribution of the S4 segment to gating charge in the Shaker K+ channel. Neuron. 16:1169–1177. - PubMed
    1. Baker, O.S., H.P. Larsson, L.M. Mannuzzu, and E.Y. Isacoff. 1998. Three transmembrane conformations and sequence-dependent displacement of the S4 domain in shaker K+ channel gating. Neuron. 20:1283–1294. - PubMed
    1. Bell, D.C., H. Yao, R.C. Saenger, J.H. Riley, and S.A. Siegelbaum. 2004. Changes in local S4 environment provide a voltage-sensing mechanism for mammalian hyperpolarization-activated HCN channels. J. Gen. Physiol. 123:5–19. - PMC - PubMed
    1. Chen, J., J.S. Mitcheson, M. Lin, and M.C. Sanguinetti. 2000. Functional roles of charged residues in the putative voltage sensor of the HCN2 pacemaker channel. J. Biol. Chem. 275:36465–36471. - PubMed
    1. Chen, S., J. Wang, and S.A. Siegelbaum. 2001. Properties of hyperpolarization-activated pacemaker current defined by coassembly of HCN1 and HCN2 subunits and basal modulation by cyclic nucleotide. J. Gen. Physiol. 117:491–504. - PMC - PubMed

Publication types

MeSH terms

Substances