. 2003 Dec;23(24):9032-45.
doi: 10.1128/MCB.23.24.9032-9045.2003.

Anoxic fibroblasts activate a replication checkpoint that is bypassed by E1a

Affiliations

Anoxic fibroblasts activate a replication checkpoint that is bypassed by E1a

Lawrence B Gardner et al. Mol Cell Biol. 2003 Dec.

Abstract

Little is known about cell cycle regulation in hypoxic cells, despite its significance. We utilized an experimentally tractable model to study the proliferative responses of rat fibroblasts when rendered hypoxic (0.5% oxygen) or anoxic (<0.01% oxygen). Hypoxic cells underwent G1 arrest, whereas anoxic cells also demonstrated S-phase arrest due to suppression of DNA initiation. Upon reoxygenation, only those cells arrested in G1 were able to resume proliferation. The oncoprotein E1a induced p53-independent apoptosis in anoxic cells, which when suppressed by Bcl-2 permitted proliferation despite anoxia. E1a expression led to marked increases in the transcription factor E2F, and overexpression of E2F-1 allowed proliferation in hypoxic cells, although it had minimal effect on the anoxic suppression of DNA initiation. We thus demonstrate two distinct cell cycle responses to low oxygen and suggest that alterations that lead to increased E2F can overcome hypoxic G1 arrest but that additional alterations, promoted by E1a expression, are necessary for neoplastic cells to proliferate despite anoxia.


Figures

FIG. 1.
FIG. 1.
Effect of hypoxia (0.5% oxygen) and anoxia on proliferation and cell cycle profiles in REF52 cells. (A) Cells were maintained in either 20% oxygen or 0.25% FCS or rendered hypoxic or anoxic. After 27 h, the cells were collected and analyzed for DNA content. FACS profiles of CFDA-labeled normoxic cells at 0, 27, and 54 h and profiles of serum-starved, hypoxic, and anoxic cells at 54 h are displayed. The arrows indicate the fluorescence of the cells at the time they were rendered hypoxic or serum starved. Decay of fluorescence beyond the arrows reflects proliferation. Experiments were repeated at least three times with duplicates each time, and averages and standard errors are shown. (B) Cells were pulse-labeled with [3H]thymidine from 24 to 27 h under the experimental conditions described above, and thymidine incorporation into DNA was measured as described in Materials and methods. The percentages of normoxic cells in S phase, as determined from the DNA contents shown in panel A, were normalized to 100%, and the percentages of serum-starved, hypoxic, and anoxic cells are relative to these normoxic cells. Similarly, [3H]thymidine incorporation by normoxic cells was normalized to 100%, and the rates of [3H]thymidine incorporation by serum-starved, hypoxic, and anoxic cells are relative to this value.
FIG. 2.
FIG. 2.
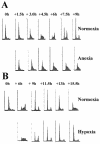
Activation of checkpoints in anoxic and hypoxic S-phase cells. (A) Serum-starved cells were stimulated with serum for 11.5 h and then either maintained as normoxic or rendered anoxic. Cells were collected at regular time points, and the DNA content was assessed regularly as described in the text. (B) Serum-starved cells were rendered hypoxic, and the DNA content was assessed regularly as described in the text.
FIG.3.
FIG.3.
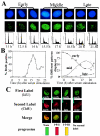
S-phase progression in normoxic and anoxic cells. (A) Normoxic REF52/Bcl-2 cells were serum starved for 48 h and then stimulated with serum. Every 1.5 h, the cells were pulse-labeled with IdU and then either fixed and stained with anti-IdU antibodies as described in the text or analyzed for DNA content. DAPI staining of nuclei is shown in the top row, and halogenated nucleus contents are shown in the middle row. (B) Incorporation of BrdU and patterns of IdU incorporation during serum starvation and stimulation of normoxic cells. (C) During serum stimulation, cells were initially pulsed with IdU, chased, and subsequently pulsed with CldU. Representative patterns of progression are shown. For demonstration purposes, progression patterns are demonstrated only when the first label was incorporated in an early pattern.
FIG. 4.
FIG. 4.
S-phase progression of normoxic and anoxic REF52 and E1a-expressing cells. (A) Schema of experimental design to assess S-phase progression in normoxic and hypoxic cells in the absence (left) or presence (right) of the elongation inhibitor aphidicolin. (B) Progression of S phase at 4 and 8 h in normoxic and anoxic cells. (C) CldU incorporation in cells rendered anoxic for 8 h while in the presence of aphidicolin.
FIG. 5.
FIG. 5.
Effects of reoxygenation on 27-h anoxic REF52 cells. (A) REF52 cells were rendered anoxic for 27 h and reexposed to 20% oxygen. After 7 to 10 days, the plates were stained and colonies were counted. The plating efficiency for normoxic unselected REF52 cells was 95%. The error bars indicate standard errors.(B) Cells were stained with CFDA, cultured for 1 day, and then either maintained as normoxic, serum starved for 27 h and then serum stimulated, or rendered anoxic for 27 h and then maintained as normoxic. At various time points, cells were collected and analyzed by FACS. Discrete peaks in the anoxic→ normoxic cells suggest different proliferative capabilities. (C) Cells were rendered anoxic for 27 h and then normoxic for 27 h. The bright (nonproliferating) and dim (proliferating) cells were sorted by FACS and plated, and colony formation was assessed. (D) After 27 h, normoxic or anoxic cells were sorted for G1 or S and G2. The cells were plated, and colony formation and thymidine incorporation over 24 h were assessed.
FIG. 6.
FIG. 6.
p53 dependence of apoptosis in anoxic MEFs. p53+/+ and p53−/− MEFs were stably transfected with E1a or control. They were then rendered anoxic or normoxic for 24 h, and apoptosis was assessed as described in the text. Experiments were repeated three times, and averages and standard errors are shown.
FIG. 7.
FIG. 7.
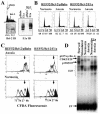
Effects of E1a on proliferation of anoxic REF52 cells. (A) REF52 cells were infected with either control or Bcl-2 retrovirus. High Bcl-2 expression was assessed by the coexpression of CD8, and high expressers were isolated by FACS. These cells, or control pBabe cells, were then infected with E1a or pBabe as described in Materials and Methods. Immunoblots (IB) of Bcl-2 and E1a reveal appropriate expression. Immunoblots of Bcl-2 in the high expressers and in control-infected cells (left) of and E1a in control-infected cells and Bcl-2-infected cells (right) are shown. (B) Proliferation of control and E1a-expressing cells assessed by DNA content and [3H]thymidine incorporation after being rendered anoxic for 27 h. (C) Proliferation of REF52/Bcl-2/pBabe and REF52/Bcl-2/E1a cells when normoxic or anoxic, as assessed by CFDA fluorescence and FACS. The arrows mark the fluorescence of normoxic cells 27 h after culture. (D) E2F EMSA on REF52/Bcl-2/pBabe cells serum starved for 48 h (Starved), serum starved and then stimulated for 16 h (Stimulated), maintained as normoxic (Normoxia), and rendered anoxic (Anoxia) with and without E1a, as labeled. Complexes were verified with supershifts, and all labeled complexes were successfully competed by unlabeled probe, but not by mutated probe (data not shown). Free probe (FP) is shown.
FIG. 8.
FIG. 8.
Effects of E2F expression on proliferation of anoxic and hypoxic cells. (A) REF52 cells were rendered anoxic (left) or hypoxic (right) for 24 h and then infected with either CMV or E2F-1 adenovirus. After an additional 24 h, the cells were collected and analyzed for DNA content. (B) Cells were serum starved for 48 h and then rendered hypoxic (right) or anoxic (left). The cells were then stimulated with serum and infected with either CMV or E2F-1; 24 h later, the cells were collected and analyzed for DNA content.
FIG. 9.
FIG. 9.
Proposed model of checkpoint activation in hypoxic (A) and anoxic (B) cells.

Similar articles

Cited by

References

    1. Alevizopoulos, K., B. Catarin, J. Vlach, and B. Amati. 1998. A novel function of adenovirus E1A is required to overcome growth arrest by the CDK2 inhibitor p27(Kip1). EMBO J. 17:5987-5997. - PMC - PubMed
    1. Amellem, O., M. Loffler, and E. O. Pettersen. 1994. Regulation of cell proliferation under extreme and moderate hypoxia: the role of pyrimidine (deoxy)nucleotides. Br. J. Cancer 70:857-866. - PMC - PubMed
    1. Amellem, O., J. A. Sandvik, T. Stokke, and E. O. Pettersen. 1998. The retinoblastoma protein-associated cell cycle arrest in S-phase under moderate hypoxia is disrupted in cells expressing HPV18 E7 oncoprotein. Br. J. Cancer 77:862-872. - PMC - PubMed
    1. Andrews, N. C., and D. V. Faller. 1991. A rapid micropreparation technique for extraction of DNA-binding proteins from limiting numbers of mammalian cells. Nucleic Acids Res. 19:2499. - PMC - PubMed
    1. Angus, S. P., L. J. Wheeler, S. A. Ranmal, X. Zhang, M. P. Markey, C. K. Mathews, and E. S. Knudsen. 2002. Retinoblastoma tumor suppressor targets dNTP metabolism to regulate DNA replication. J. Biol. Chem. 277:44376-44384. - PubMed

Publication types

Substances