Case Reports
. 2004 Feb 1;554(Pt 3):635-47.
doi: 10.1113/jphysiol.2003.053082. Epub 2003 Nov 14.

Functional characterization and cold sensitivity of T1313A, a new mutation of the skeletal muscle sodium channel causing paramyotonia congenita in humans

Affiliations
Case Reports

Functional characterization and cold sensitivity of T1313A, a new mutation of the skeletal muscle sodium channel causing paramyotonia congenita in humans

Magali Bouhours et al. J Physiol. .

Abstract

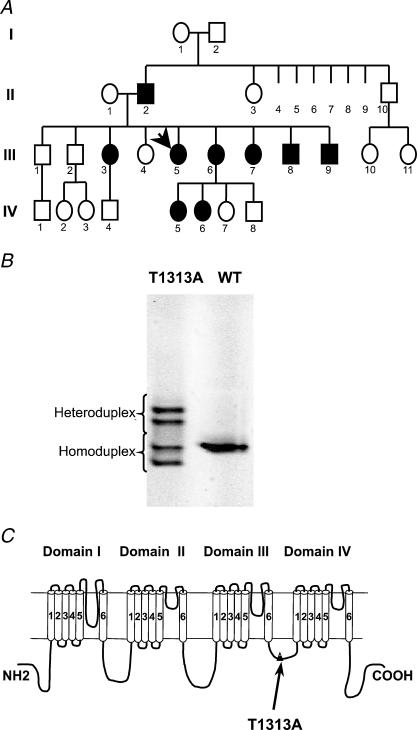
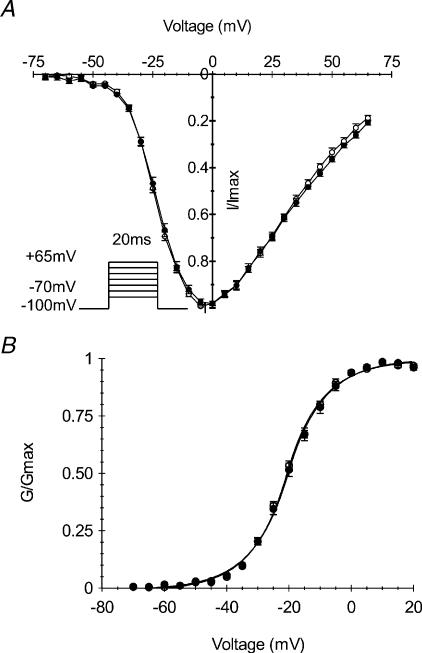
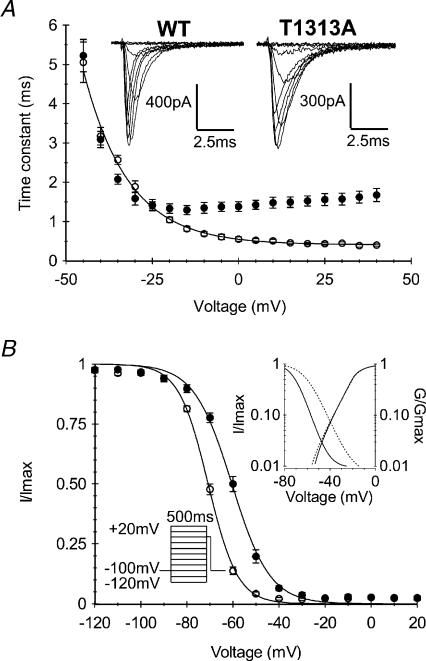
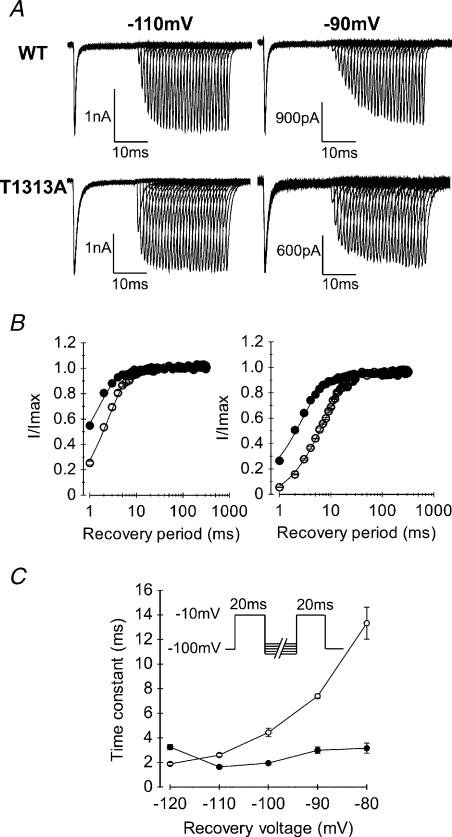
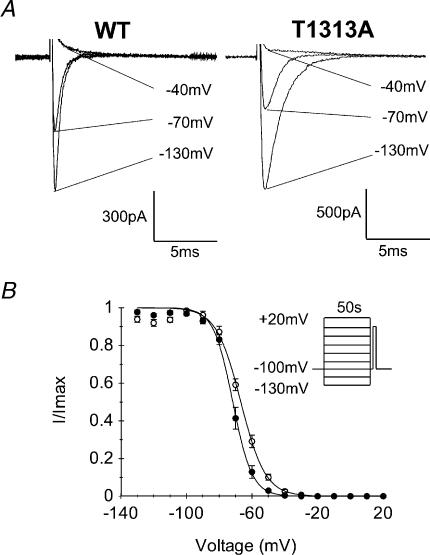
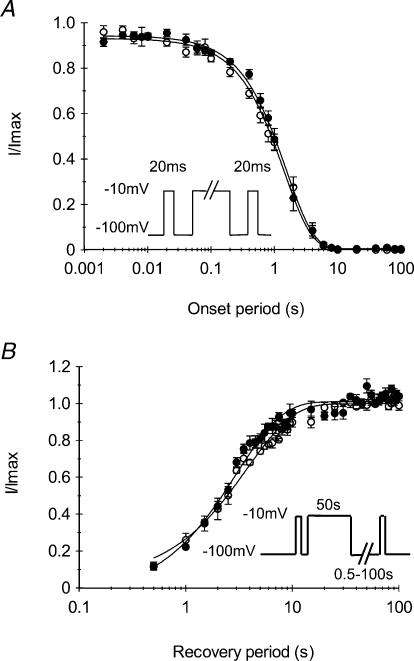
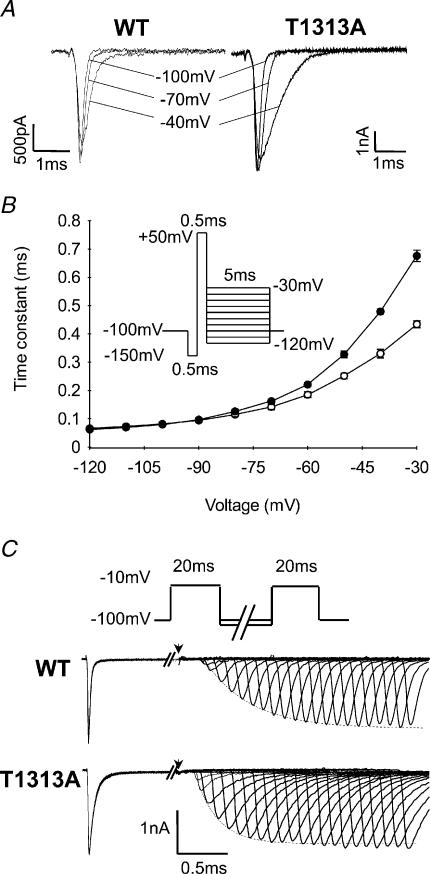
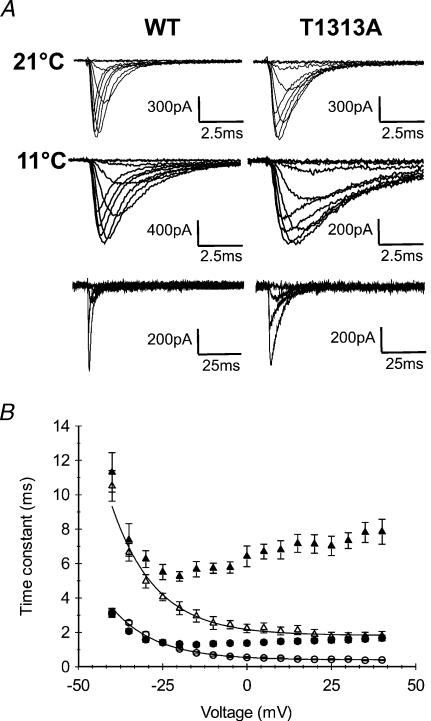
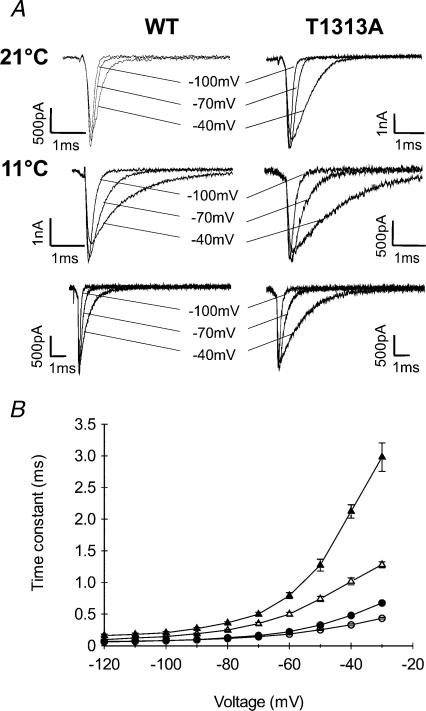
Paramyotonia congenita (PC) is a dominantly inherited skeletal muscle disorder caused by missense mutations in the SCN4A gene encoding the pore-forming alpha subunit (hSkM1) of the skeletal muscle Na+ channel. Muscle stiffness is the predominant clinical symptom. It is usually induced by exposure to cold and is aggravated by exercise. The most prevalent PC mutations occur at T1313 on DIII-DIV linker, and at R1448 on DIV-S4 of the alpha subunit. Only one substitution has been described at T1313 (T1313M), whereas four distinct amino-acid substitutions were found at R1448 (R1448C/H/P/S). We report herein a novel mutation at position 1313 (T1313A) associated with a typical phenotype of PC. We stably expressed T1313A or wild-type (hSkM1) channels in HEK293 cells, and performed a detailed study on mutant channel gating defects using the whole-cell configuration of the patch-clamp technique. T1313A mutation impaired Na+ channel fast inactivation: it slowed and reduced the voltage sensitivity of the kinetics, accelerated the recovery, and decreased the voltage-dependence of the steady state. Slow inactivation was slightly enhanced by the T1313A mutation: the voltage dependence was shifted toward hyperpolarization and its steepness was reduced compared to wild-type. Deactivation from the open state assessed by the tail current decay was only slowed at positive potentials. This may be an indirect consequence of disrupted fast inactivation. Deactivation from the inactivation state was hastened. The T1313A mutation did not modify the temperature sensitivity of the Na+ channel per se. However, gating kinetics of the mutant channels were further slowed with cooling, and reached levels that may represent the threshold for myotonia. In conclusion, our results confirm the role of T1313 residue in Na+ channel fast inactivation, and unveil subtle changes in other gating processes that may influence the clinical phenotype.


Figures

Figure 1
Figure 1. Genetic evidence of T1313A mutation
A, pedigree structure of the T1313A proband (arrow). PC Affected members are indicated by filled symbols. B, gel obtained by denaturing gradient gel electrophoreses (DDGE) analysis of PCR amplified SCN4A exon 22 showing a variant profile. Subsequent sequencing of exon 22 identified a G to A transition at nucleotide 3937 predicting T1313A mutation in the α subunit. C, topology of the α subunit of the skeletal muscle Na+ channel showing the location of T1313A mutation in the DIII–DIV linker.
Figure 2
Figure 2. Voltage dependence of Na+ channel activation
Normalized current to voltage (A) and conductance to voltage (B) relationships obtained from HEK cells expressing either T1313A (•n= 11) or WT (○n= 10) Na+ channels. Whole-cell currents were elicited by a series of 20 ms pulses to various voltages ranging from −70 to +65 mV from a holding potential of −100 mV. The continuous lines in B represent Boltzmann fits of the data (V0.5: −20.9 ± 0.8 mV and −21.8 ± 0.5 mV, k: 8.9 ± 0.2 and 8.5 ± 0.2 for T1313A and WT channels, respectively).
Figure 3
Figure 3. Voltage dependence and kinetics of fast inactivation
A, representative traces of whole cell Na+ currents, and voltage dependence of the fast inactivation time constant obtained from monoexponential fitting of the current decay during a 20 ms depolarizing pulse. Note the slower inactivation kinetics of T1313A channels (•n= 11) compared with WT (○n= 10), and the reduced voltage sensitivity at potentials positive to −20 mV. B, voltage dependence of steady-state fast-inactivation for T1313A (•n= 7) and WT (○n= 12) channels measured with a double pulse protocol as illustrated in the left inset. The right inset shows both activation and inactivation curves on a logarithmic scale to highlight the window current. Note the enlargement of the window current at positive potentials induced by T1313A mutation.
Figure 4
Figure 4. Recovery from fast inactivation
A, representative traces of WT and T1313A currents obtained for recovery interpulse potentials of −110 or −90 mV using the two-pulse protocol shown in C (inset). Note the faster recovery of T1313A channels compared to WT at both voltages. B, kinetics of recovery from fast inactivation obtained at recovery potentials of −110 mV (left, • T1313A n= 9, and ○ WT n= 7), and −90 mV (right, • T1313A n= 7, and ○ WT n= 5). C, voltage dependence of the recovery time constants obtained by fitting successive peaks of the recovered currents with single exponential functions. In contrast to the WT (○n= 5–8), T1313A mutant channels (•n= 6–9) recovery from fast inactivation does not change significantly with the repolarizing voltage.
Figure 5
Figure 5. Voltage dependence of slow inactivation
A, representative traces showing the gradual decrease in peak Na+ current following long lasting (50 s) conditioning pulses at −130 mV, −70 mV and −40 mV in WT and T1313A mutant (capacitive currents were blanked). B, steady-state slow inactivation curves obtained using the two-pulse protocol shown as inset. Cells were maintained at the holding potential (−100 mV) for 50 s between each conditioning pulse to prevent accumulation of slow inactivation, and repolarized at −100 mV for 20 ms between the conditioning and the test pulse to allow Na+ channel recovery from fast inactivation. Data obtained from both WT and T1313A channels could be fitted to the Boltzmann equation as symbolized by the continuous lines. Notice the slight shift toward hyperpolarization in the voltage dependence of slow inactivation for T1313A (•n= 7) channels compared with WT (○n= 6).
Figure 6
Figure 6. Kinetics of slow inactivation
A, to measure the entry to slow inactivation, a reference pulse of −10 mV was applied for 20 ms followed by a conditioning pulse to −10 mV of increasing durations (0.02–100 s) and a test pulse to evaluate the fraction of slow inactivated channels. Between the conditioning and the test pulse the membrane was repolarized to −100 mV for 20 ms to allow selective recovery from fast inactivation. Current amplitudes elicited by the test pulse were normalized to the peak current evoked by the reference pulse, and plotted against the conditioning pulse duration to yield the time constant of entry to slow inactivation. As indicated by the superimposed data from mutant (•n= 5) and WT (○n= 5) channels, T1313A mutation did not modify the entry of Na+ channels to slow inactivation. B, recovery from slow inactivation was measured using the protocol shown next to the curves. Slow inactivation was induced by 50 s pulses, and recovery periods at −100 mV ranged from 0.5 to 100 s. The curves depicting the fraction of recovered currents against the recovery periods do not show any difference between WT (○n= 5) and T1313A (•n= 5) channels.
Figure 7
Figure 7. Deactivation from open and inactivated states
A, representative traces of tail currents reflecting deactivation of Na+ channels from the open state. Tail currents were elicited by 5 ms repolarizing steps following a brief depolarization (0.5 ms) to +50 mV, as illustrated by the protocol in B. B, kinetics of the tail current at various voltages represented by the time constant of the monoexponential tail decay for T1313A (•n= 12) and WT (○n= 6) channels. Note that the slight slowing of the tail current decay of T1313A channels, as compared to the WT, is only observed at potentials positive to −60 mV. C, deactivation from the inactivated state was assessed by the delay in onset to recovery from fast inactivation. Recovery periods ranged from 0.05 to 11 ms. Below the standard two-pulse protocol are shown traces of recovered Na+ currents following membrane repolarization at −100 mV. The arrows indicate the end of the first depolarizing pulse. Note the shorter delay in onset to recovery for the mutant compared with WT.
Figure 8
Figure 8. Effect of 10°C cooling on fast inactivation kinetics
A, superimposed Na+ currents recorded at 21°C (upper traces) or 11°C (middle and lower traces). Upper and middle traces were obtained using 20 ms depolarizing pulses; the lower traces were obtained with longer pulses (100 ms) to show full current inactivation. B, voltage dependence of the fast inactivation time constant measured at 21°C (• T1313A (n= 11), ○ WT (n= 10)) and at 11°C (▴ T1313A (n= 6), ▵ WT (n= 5)). Fast inactivation kinetics were slowed by a comparable factor with decreased temperature. Note however, that at potentials positive to −20 mV, the data obtained for T1313A channels at 10°C, are clearly out of the range delimited by the three other groups (WT at 11°C and 21°C, and mutant at 21°C).
Figure 9
Figure 9. Effect of 10°C cooling on open state deactivation
A, representative traces of Na+ tail currents recorded at 21°C or 11°C using the protocol described in Fig. 7 (upper and middle traces). The lower traces were obtained using longer repolarizing pulses (25 ms) to show full decay of the tail current. B, voltage dependence of the kinetics of the tail current decay (see Fig. 7) measured at 21°C (• T1313A (n= 12), ○ WT (n= 6)), and at 11°C (▴ T1313A (n= 6), ▵ WT (n= 5)). The slowing of the decay time constant with cooling was more striking for T1313A channels at positive potentials.

Similar articles

Cited by

References

    1. Aldrich RW, Stevens CF. Inactivation of open and closed sodium channels determined separately. Cold Spring Harb Symp Quant Biol. 1983;48:147–153. - PubMed
    1. Almers W, Roberts WM, Ruff RL. Voltage clamp of rat and human skeletal muscle: measurements with an improved loose-patch technique. J Physiol. 1984;347:751–768. - PMC - PubMed
    1. Armstrong CM, Bezanilla F. Inactivation of the sodium channel. II. Gating current experiments. J General Physiol. 1977;70:567–590. - PMC - PubMed
    1. Barchi RL. Protein components of the purified sodium channel from rat skeletal muscle sarcolemma. J Neurochem. 1983;40:1377–1385. - PubMed
    1. Bendahhou S, Cummins TR, Kula RW, Fu YH, Ptacek LJ. Impairment of slow inactivation as a common mechanism for periodic paralysis in DIIS4-S5. Neurology. 2002;58:1266–1272. - PubMed

Publication types

MeSH terms

LinkOut - more resources