. 2003 Nov 25;100(24):14269-74.
doi: 10.1073/pnas.2336099100. Epub 2003 Nov 5.

Epstein-Barr virus provides a survival factor to Burkitt's lymphomas

Affiliations

Epstein-Barr virus provides a survival factor to Burkitt's lymphomas

Gregory Kennedy et al. Proc Natl Acad Sci U S A. .

Abstract

Epstein-Barr virus (EBV) has been causally associated with at least five human malignancies. The exact contributions made by EBV to these cancers remain unknown. We demonstrate that one viral protein found in all EBV-associated malignancies, Epstein-Barr nuclear antigen 1 (EBNA-1), is required for survival of one of these cancers, EBV-positive Burkitt's lymphoma. Inhibition of EBNA-1 decreases survival of these tumor cells by inducing apoptosis. Expression of EBNA-1 in uninfected cells also can inhibit apoptosis induced by expression of p53 in the absence of the EBV genome. Our findings demonstrate that EBNA-1 is critical for the continued survival of EBV-associated Burkitt's lymphoma, and, by extension, for the other B cell tumors with which EBV is associated. Efficient inhibitors of EBNA-1's functions would likely prove useful in the therapy of EBV-associated malignancies.


Figures

Fig. 1.
Fig. 1.
The structure of EBNA-1 and the Dom Neg derivatives used are represented schematically at the top. Dom Neg 1 consists only of the nuclear localization sequence (NLS) and the DNA-binding domain of EBNA-1. Dom Neg 2 has a deletion of 25 residues from linking region 1 (LR1) of EBNA-1 and is otherwise intact. (Bottom) The retroviruses used for expression of the EBNA-1 derivatives (Dom Neg 1 and 2).
Fig. 2.
Fig. 2.
Inhibition of EBNA-1 by Dom Neg 1 can select for loss of EBV DNA in the EBV-positive Akata cell line. (A) The EBV-negative 293/EBNA-1 and BJAB and the EBV-positive Akata and 721 cell lines were infected with a retrovirus expressing Dom Neg 1. Infected cells were sorted and plated in limiting dilutions. Clones that grew after 14 days were expanded, and Western analyses were performed. Wild-type EBNA-1 is detected in 293/EBNA-1 (293) and 721 cell lines, but not in BJAB cells or in Akata clones 2, 3, and 5. Dom Neg 1 can be detected in all cell lines infected with the Dom Neg 1-expressing retrovirus. (B) DNA was harvested from each of the surviving clones, and Southern analyses were performed. EBV DNA readily can be detected in the EBV-positive cell line 721 infected with either the control or Dom Neg 1-expressing retrovirus. However, EBV-DNA has been lost from the Akata clones 2, 3, 5, 6, and 8 that were infected with Dom Neg 1, which correlates with the loss of EBNA-1 expression in clones 2, 3, and 5 (see A above). EBV DNA from the Akata clones infected with control retrovirus was readily detected.
Fig. 3.
Fig. 3.
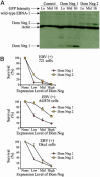
Inhibition of EBNA-1 leads to a dose-dependent decrease in survival. (A) The EBV-positive, normal B cell line, 721, was infected with the control retrovirus or ones expressing Dom Neg 1 or 2. Infected cells were sorted 72 h postinfection for the top 15%, middle 15%, and bottom 15% of green intensity. The sorted cells were collected, and Western blots were performed. (B) Cells were infected and sorted for the top 15% green, middle 15% green, and bottom 15% of green expression and were assayed for survival. The decrease in survival between low, middle, and high GFP expression of cells infected with Dom Neg 1 or 2 is statistically significant in all three of the EBV-positive cell lines tested (P < 0.05, Jonckheere-Terpstra test).
Fig. 4.
Fig. 4.
The Dom Neg derivatives of EBNA-1 do not inhibit growth of EBV-negative B cells, whereas efficient expression of wild-type EBNA-1 does. The EBV-negative B cell line, BJAB, was infected with retroviruses expressing control, Dom Neg 1 or 2, or wild-type EBNA-1. Infected cells were sorted 48 h postinfection for the highest 15%, middle 15%, and lowest 15% intensity of GFP expression, plated in limiting dilutions, and scored for survival. The average survival of cells infected with the control virus was calculated and was set at 100% survival (average). The survival of cells infected with wild-type EBNA-1 sorted for low, middle, and high was 11%, 3%, and 0.1%, respectively. Survival of cells infected with Dom Neg 1 sorted for low, middle, and high was 129%, 129%, and 86%, respectively. Survival of cells infected with Dom Neg 2 sorted for low, middle, and high was 93%, 93%, and 51%, respectively.
Fig. 5.
Fig. 5.
Inhibition of EBNA-1's functions by Dom Neg 1 or 2 leads to apoptosis of EBV-positive cells without their prior loss of viral DNA or EBERs. (A) The EBV-positive normal B cell line, 721, was infected with retroviruses expressing either control or Dom Neg 1. Morphologic evidence of apoptosis was present in 5-25% of 721 cells infected with Dom Neg 1 in three independent assays, which was 4-fold greater than the evidence of apoptosis identified in cells infected with control virus (P < 0.05). (B) Seventy-two hours postinfection, the EBV-positive BL cell line, Oku1, was scored for the fraction of green cells staining positively for apoptosis by the TUNEL assay. In three independent infections, each performed in duplicate, the fraction of cells infected with Dom Neg 1 or 2 that stained positively by the TUNEL assay ranged from 20% to 45%, which was seven to eight times higher than that of cells infected with the control retrovirus (P < 0.05). (C) Oku1 cells were infected, and, at 72 h, were stained with annexin V conjugated to Alexa Flour 647. Green cells were sorted plus or minus annexin V, their DNA was isolated, and the number of molecules of EBV DNA was assayed by real-time PCR and normalized to values of actin. The number of EBV DNA molecules does not change significantly in cells that are undergoing apoptosis. (D) Oku1 cells were infected, and cells were sorted 72 h postinfection for the top 15%, middle 15%, and bottom 15% of green intensity. Reverse transcription followed by PCR was performed on each fraction to determine relative expression levels of the EBER1, EBER2, and actin genes. Below each lane are shown expression levels of each of the bands adjusted for the intensity of the actin amplification product relative to the intensity of the actin product from the uninfected cells. The levels of EBER1 and EBER2 are not related to the survival of the infected Oku1 cells.
Fig. 6.
Fig. 6.
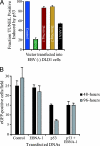
Expression of EBNA-1 in DLD1 cells inhibits p53's ability to kill cells. (A) The p53-negative human colon carcinoma cell line, DLD1, was transfected with DNA encoding p53 to induce apoptosis in the presence of a DNA-encoding EGFP, and an empty vector (control) or DNAs encoding wild-type EBNA-1, Dom Neg 1 or 2, or LANA-1. Forty-eight hours posttransfection, the cells were stained by the TUNEL assay, and the fraction of TUNEL-positive, green cells was measured in three independent transfections performed in duplicate. EBNA-1 inhibited p53's ability to induce apoptosis 5-fold (P < 0.05). Importantly, Dom Neg 1 and 2 had no effect on p53's ability to induce apoptosis. LANA-1 was found to inhibit p53's ability to induce apoptosis by 50%, which was consistent with what has been reported (33). (B) DLD1 cells were transfected with plasmid DNAs expressing EGFP, with or without cells expressing p53 and EBNA-1. Approximately 24 h posttransfection, cells were trypsinized and plated on gridded tissue culture plates. The number of cells expressing EGFP per grid (low power field) was counted 48- and 96-h post-transfection, and 100-200 cells were counted per plate. There is a statistically significant reduction in the number of cells expressing EGFP and transfected with p53 by 48 h (15 EGFP-expressing cells per field) compared with control (25 EGFP-expressing cells per field) or EBNA-1 (24 EGFP-expressing cells per field) (P = 0.04). This reduction was also seen at 96 h posttransfection (P = 0.02). We found fewer green cells transfected with p53 and EBNA-1 (15 EGFP-expressing cells per field) when compared with control (P = 0.08) at 48 h. By 96 h, EBNA-1, when coexpressed with p53, increased the number of green cells per field (15 EGFP-expressing cells per field) compared with cells transfected with p53 alone (seven EGFP-expressing cells per field) (P = 0.02). At 96 h, there is no statistically significant difference in the number of green cells transfected with GFP from those transfected with GFP plus EBNA-1 (P = 0.5), indicating that under these experimental conditions in which EBNA-1 inhibits apoptosis, EBNA-1 alone is not inhibiting survival or proliferation of DLD1 cells.
Fig. 7.
Fig. 7.
Outlined are multiple events in the normal development of B cells that can lead to apoptosis (36). Infection with EBV leads to survival of B cells with nonfunctional B cell receptors (BCR), avoiding apoptosis associated with peripheral B cell homeostasis, and results in latent infection within long-term memory B cells (37, 38). Inhibition of EBNA-1 results in apoptosis in all of the EBV-infected B cells we have tested.

Similar articles

Cited by

References

    1. Evens, A. M. & Gordon, L. I. (2002) Curr. Treat. Options Oncol. 3, 291-305. - PubMed
    1. Boxer, L. M. & Dang, C. V. (2001) Oncogene 20, 5595-5610. - PubMed
    1. Lindstrom, M. S., Klangby, U. & Wiman, K. G. (2001) Oncogene 20, 2171-2177. - PubMed
    1. Lindstrom, M. S. & Wiman, K. G. (2002) Semin. Cancer Biol. 12, 381-387. - PubMed
    1. Niedobitek, G., Meru, N. & Delecluse, H. J. (2001) Int. J. Exp. Pathol. 82, 149-170. - PMC - PubMed

Publication types

Substances