

Mixed bilayer containing dipalmitoylphosphatidylcholine and dipalmitoylphosphatidylserine: lipid complexation, ion binding, and electrostatics
- PMID: 14581212
- PMCID: PMC1303588
- DOI: 10.1016/S0006-3495(03)74730-4
Mixed bilayer containing dipalmitoylphosphatidylcholine and dipalmitoylphosphatidylserine: lipid complexation, ion binding, and electrostatics
Abstract
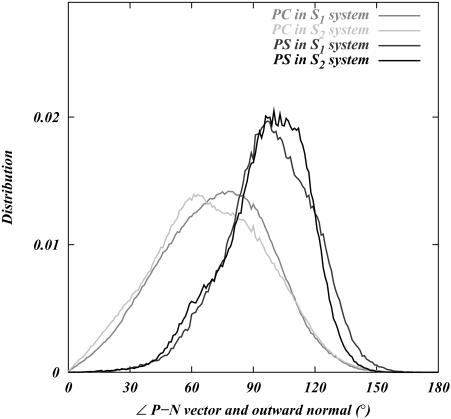
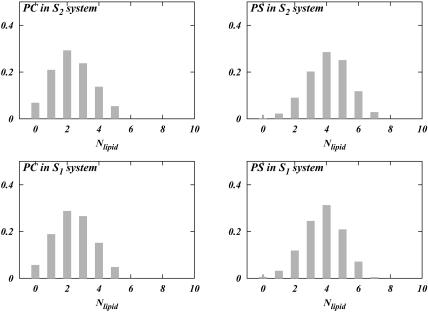
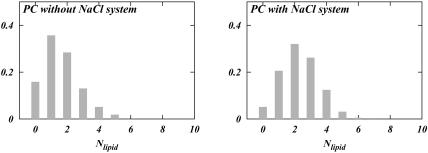
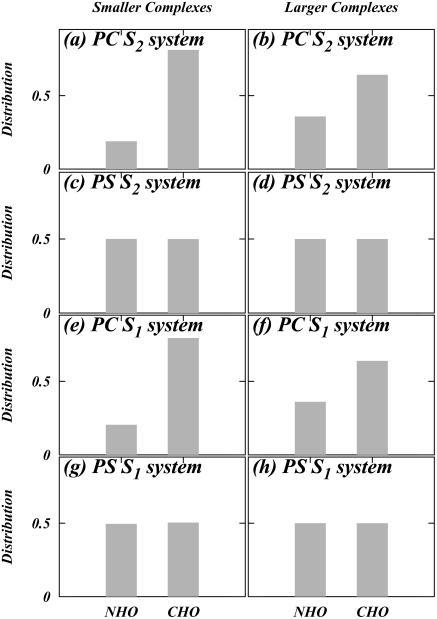
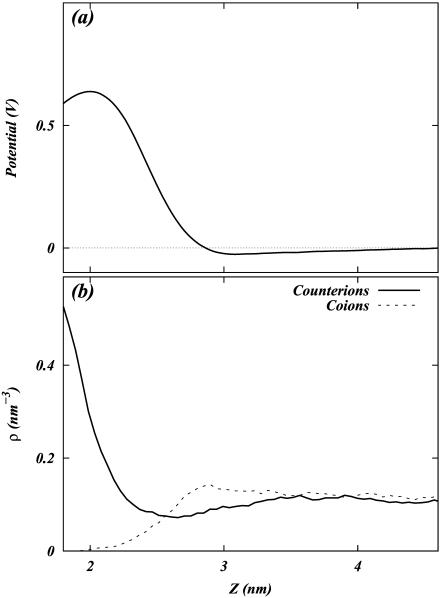
Two mixed bilayers containing dipalmitoylphosphatidylcholine and dipalmitoylphosphatidylserine at a ratio of 5:1 are simulated in NaCl electrolyte solutions of different concentration using the molecular dynamics technique. Direct NH.O and CH.O hydrogen bonding between lipids was observed to serve as the basis of interlipid complexation. It is deduced from our results and previous studies that dipalmitoylphosphatidylcholine alone is less likely to form interlipid complexes than in the presence of bound ions or other bilayer "impurities" such as dipalmitoylphosphatidylserine. The binding of counterions is observed and quantitated. Based upon the calculated ion binding constants, the Gouy-Chapman surface potential (theta) is calculated. In addition we calculated the electrostatic potential profile (Phi) by twice integrating the system charge distribution. A large discrepancy between and the value of Phi at the membrane surface is observed. However, at "larger" distance from the bilayer surface, a qualitative similarity in the z-profiles of Phi and psi(GC) is seen. The discrepancy between the two potential profiles near the bilayer surface is attributed to the discrete and nonbulk-like nature of water in the interfacial region and to the complex geometry of this region.
Figures


Similar articles
-
Molecular dynamics simulation of a dipalmitoylphosphatidylcholine bilayer with NaCl.Biophys J. 2003 Jun;84(6):3743-50. doi: 10.1016/S0006-3495(03)75102-9. Biophys J. 2003. PMID: 12770880 Free PMC article.
-
Molecular dynamics simulation of a palmitoyl-oleoyl phosphatidylserine bilayer with Na+ counterions and NaCl.Biophys J. 2004 Mar;86(3):1601-9. doi: 10.1016/S0006-3495(04)74227-7. Biophys J. 2004. PMID: 14990486 Free PMC article.
-
Study of the effect of Na+ and Ca2+ ion concentration on the structure of an asymmetric DPPC/DPPC + DPPS lipid bilayer by molecular dynamics simulation.Colloids Surf B Biointerfaces. 2009 Oct 1;73(1):42-50. doi: 10.1016/j.colsurfb.2009.04.028. Epub 2009 May 9. Colloids Surf B Biointerfaces. 2009. PMID: 19487110
-
A computer perspective of membranes: molecular dynamics studies of lipid bilayer systems.Biochim Biophys Acta. 1997 Nov 21;1331(3):235-70. doi: 10.1016/s0304-4157(97)00008-7. Biochim Biophys Acta. 1997. PMID: 9512654 Review. No abstract available.
-
Computer modelling studies of the bilayer/water interface.Biochim Biophys Acta. 2016 Oct;1858(10):2305-2321. doi: 10.1016/j.bbamem.2016.01.024. Epub 2016 Jan 26. Biochim Biophys Acta. 2016. PMID: 26825705 Review.
Cited by
-
Incorporating Phase-Dependent Polarizability in Non-Additive Electrostatic Models for Molecular Dynamics Simulations of the Aqueous Liquid-Vapor Interface.J Chem Theory Comput. 2009 Feb 10;5(2):359-373. doi: 10.1021/ct800320f. Epub 2009 Jan 8. J Chem Theory Comput. 2009. PMID: 23133341 Free PMC article.
-
Molecular dynamics simulations of mixed acidic/zwitterionic phospholipid bilayers.Biophys J. 2010 Aug 4;99(3):825-33. doi: 10.1016/j.bpj.2010.04.064. Biophys J. 2010. PMID: 20682260 Free PMC article.
-
Molecular dynamics simulations of SOPS and sphingomyelin bilayers containing cholesterol.Biophys J. 2007 Feb 15;92(4):1284-95. doi: 10.1529/biophysj.106.096214. Epub 2006 Dec 1. Biophys J. 2007. PMID: 17142272 Free PMC article.
-
Charge equilibration force fields for lipid environments: applications to fully hydrated DPPC bilayers and DMPC-embedded gramicidin A.J Phys Chem B. 2009 Jul 9;113(27):9183-96. doi: 10.1021/jp901088g. J Phys Chem B. 2009. PMID: 19526999 Free PMC article.
-
Structural, dynamic, and electrostatic properties of fully hydrated DMPC bilayers from molecular dynamics simulations accelerated with graphical processing units (GPUs).J Comput Chem. 2011 Nov 15;32(14):2958-73. doi: 10.1002/jcc.21871. Epub 2011 Jul 26. J Comput Chem. 2011. PMID: 21793003 Free PMC article.
References
-
- Berendsen, H., D. van der Spoel, and R. van Drunen. 1995. GROMACS: a message-passing parallel molecular dynamics implementation. Comp. Phys. Comm. 91:43–56.
-
- Boda, D., K.-Y. Chan, and D. Henderson. 1998. Monte Carlo simulation of an ion-dipole mixture as a model of an electrical double layer. J. Chem. Phys. 109:7362–7371.
-
- Boda, D., D. Henderson, A. Patrykiejew, and S. Sokolowski. 2000. Simulation and density functional study of simple membrane. II. Solvent effects using the solvent primitive model. J. Chem. Phys. 113:802–806.
-
- Boda, D., D. Henderson, R. Rowley, and S. Sokolowski. 1999. Simulation and density functional study of a simple membrane separating two restricted primitive model electrolytes. J. Chem. Phys. 111:9382–9388.
Publication types
MeSH terms
Substances
Grants and funding
LinkOut - more resources
Full Text Sources
Miscellaneous
