. 2003 Oct 1;22(19):5137-46.
doi: 10.1093/emboj/cdg484.

Zinc fingers can act as Zn2+ sensors to regulate transcriptional activation domain function

Affiliations

Zinc fingers can act as Zn2+ sensors to regulate transcriptional activation domain function

Amanda J Bird et al. EMBO J. .

Abstract

The yeast Zap1 transcription factor controls the expression of genes involved in zinc accumulation and storage. Zap1 is active in zinc-limited cells and repressed in replete cells. Zap1 has two activation domains, AD1 and AD2, which are both regulated by zinc. AD2 function was mapped to a region containing two Cys2His2 zinc fingers, ZF1 and ZF2, that are not involved in DNA binding. More detailed mapping placed AD2 almost precisely within the endpoints of ZF2, suggesting a role for these fingers in regulating activation domain function. Consistent with this hypothesis, ZF1 and ZF2 bound zinc in vitro but less stably than did zinc fingers involved in DNA binding. Furthermore, mutations predicted to disrupt zinc binding to ZF1 and/or ZF2 rendered AD2 constitutively active. Our results also indicate that the repressed form of AD2 requires an intramolecular interaction between ZF1 and ZF2. These studies suggest that these zinc fingers play an unprecedented role as zinc sensors to control activation domain function.


Figures

None
Fig. 1. A depiction of the Zap1 protein. The positions of the seven Zap1 zinc fingers are shown with filled boxes and are numbered. The DNA binding domain (DBD) requires fingers 3–7. Zap1’s two activation domains (AD1 and AD2) are shown with hatched boxes; the location of AD2 reflects the detailed mapping data from Figure 2. The lower panel shows the sequence of Zap1 fingers 1 and 2 (residues 579–641). The positions of the β-strands and α-helices are indicated. Residues conserved in other zinc fingers are shown below the Zap1 sequence; ψ, hydrophobic. The C and G ‘finger core’ residues (C590 and G627) are boxed, the α-helical residues that also contribute to the hydrophobic core are underlined, and the residues proposed to make interfinger contacts are circled.
None
Fig. 2. Mapping AD2 within the 552–705 region. The indicated regions of Zap1 were fused to the GBD and expressed in gal4Δ cells (ABY29) co-transformed with the GAL1-lacZ reporter. Cells were grown to exponential phase in low zinc conditions (LZM + 3 µM ZnCl2) prior to β-galactosidase activity assays. A representative experiment is shown and each value is the mean of three replicates. Error bars represent 1 SD.
None
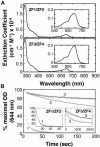
Fig. 3. Determining the affinity of Zn2+ binding by Zap1 zinc fingers. The ability of ZF1/ZF2 (top panel) or ZF3/ZF4 (bottom panel) peptides to compete with the indicator Fura-2 for Zn2+ was tracked by following the loss of absorbance at 381 nm (squares indicate decreasing apo-Fura-2 concentration) and the increase of absorbance at 332 nm (circles indicate increasing Zn-Fura-2 concentration). The solution contained 15 µM Fura-2, 10 µM apo-protein, 100 µM Tris–Cl, pH 7.5. The Zn2+ titrations were performed by adding 4 µl aliquots of ZnCl2 by Hamilton syringe through an oxygen-free sealed cuvette septum. After mixing, the absorbance spectrum was scanned from 240 to 560 nm before the next titration. The final absorbance values and Zn2+ concentrations were corrected for dilution. The data was fit by the program DYNAFIT with all parameters assigned except the dissociation constants of the zinc finger pairs. A representative of three independent experiments is shown in each panel.
None
Fig. 4. Lability of zinc binding by ZF1/ZF2 and ZF3/ZF4 peptides. Peptides containing the indicated fingers and with 2 mol eq Zn2+ bound initially were extensively dialyzed against buffer alone (B) or buffer containing the indicated compound (1,7P, 1, 7-phenanthroline; 1,10P, 1,10-phenanthroline) (10 µM). After dialysis for 1 or 2 days, the zinc and protein content was determined. One hundred percent is defined as zinc content of the sample prior to dialysis. The averages of two sample experiments are shown and the error bars represent ±1 SD.
None
Fig. 5. Co2+ and Zn2+ titration of Zap1 ZF1/ZF2 and ZF3/ZF4 peptides. (A) Spectra of Co2+-ZF1/ZF2 and Co2+-ZF3/ZF4 were measured with samples containing 100 µM Co2+ and 50 µM of the indicated peptide. Addition of Co2+ to either metal-free ZF1/ZF2 or ZF3/ZF4 peptides resulted in the formation of a peak with a maximum at 644 nm and a shoulder at 580 nm. Addition of higher concentrations of Co2+ did not change these spectra (data not shown). (B) After addition of Zn2+ to a solution containing the indicated Co2+–protein complex, the loss of absorbance at 644 nm was monitored over time. The final concentrations were 100 µM Co2+, 100 µM Zn2+, 50 µM ZF1/ZF2 peptide (curve 1), 100 µM Co2+, 100 µM Zn2+, 50 µM ZF3/ZF4 peptide (curve 3), or 100 µM Co2+, 1000 µM Zn2+, 50 µM ZF3/ZF4 peptide (curve 2). The data were fit to single exponential curves (insets), giving exchange t1/2 values of ∼5.9 s for ZF1/ZF2 (curve 1), ∼441 s for ZF3/ZF4 (curve 3) or ∼253 s for ZF3/ZF4, where the exchange is driven by extremely high [Zn2+] (curve 2).
None
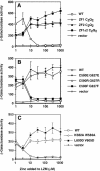
Fig. 6. Strain ABY29 (gal4Δ) was transformed with the GAL1-lacZ reporter and plasmids expressing the indicated ZAP1 mutations in the GBD–Zap1552–705 fusion protein or the vector-only control. These cells were grown to exponential phase in LZM medium plus the indicated concentration of ZnCl2. Representative experiments are shown and each value is the mean of three replicates. Error bars represent ±1 SD.
None
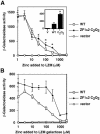
Fig. 7. Effects of ZF1/ZF2 mutations on the zinc responsiveness of full-length Zap1. ZHY6 (zap1Δ) cells transformed with the ZRE-lacZ (pDg2) reporter and pYef2 (vector), full-length wild-type Zap1 (pMyc-Zap1), or full-length Zap1 with the ZF1/ZF2 C2Q2 mutations (pZF1/21880) were grown in LZM medium plus the indicated concentration of ZnCl2. (A) Low-level expression of Zap1 from the GAL1 promoter in glucose-grown cells. DNA binding control occurs normally under these conditions. The inset shows the data for these strains grown in LZM + 300 µM ZnCl2. The asterisks indicate a significant difference from wild type (P < 0.05) as estimated by ANOVA. (B) High-level expression of Zap1 from the GAL1 promoter in galactose-grown cells. ZRE occupancy is constitutive under these conditions. A representative experiment of three separate experiments is shown and each value is the mean of three replicates. Error bars represent ±1 SD.
None
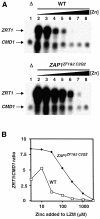
Fig. 8. Effects of ZF1/ZF2 mutations in the chromosomal ZAP1 gene on the regulation of gene expression. (A) Total RNA was extracted from exponential-phase cultures of the zap1 mutant strain ZHY6 (Δ) grown in LZM media supplemented with 3000 µM Zn2+ (lane 1) and from the wild-type strain, DY1457 and a chromosomal ZAP1ZF1&2 C2Q2 mutant, grown in LZM media supplemented with 3, 10, 30, 100, 300, 1000 and 3000 µM Zn2+ (lanes 2–8, respectively). The levels of ZRT1 mRNA were compared to the loading control CMD1 mRNA using S1 nuclease protection assays. Arrows indicate ZRT1 and CMD1 S1 nuclease protection products. (B) The band intensities in (A) were quantified and are plotted as the ratio of ZRT1:CMD1 mRNA levels at each zinc concentration. A representative of three independent experiments is shown.
None
Fig. 9. Model for the zinc-repressed form of Zap1 activation domain 2. Shown is a ribbon diagram of the structural model of ZF1 and ZF2 of Gli (Pavletich and Pabo, 1993). The zinc-binding cysteine and histidine residues are colored in blue and the Zn2+ atoms are colored in cyan. These two Gli fingers make intramolecular protein–protein contacts with each other. The amino acids that contribute to the intramolecular packing interface between these fingers are colored in red. These consist of two W residues in the β-hairpin loops between the cysteinyl ligands and two hydrophobic residues in each of the two α-helices. Zap1 ZF1 and ZF2 contain similarly positioned W residues and hydrophobic residues in the α-helices. These residues are labeled in the model with the position and the identity of the corresponding Zap1 amino acids.

Similar articles

Cited by

References

    1. Andrews G.K. (2001) Cellular zinc sensors: MTF-1 regulation of gene expression. Biometals, 14, 223–237. - PubMed
    1. Atar D., Backx,P.H., Appel,M.M., Gao,W.D. and Marban,E. (1995) Excitation–transcription coupling mediated by zinc influx through voltage-dependent calcium channels. J. Biol. Chem., 270, 2473–2477. - PubMed
    1. Berg J.M. and Godwin,H.A. (1997) Lessons from zinc binding peptides. Ann. Rev. Biophys. Biomol. Struct., 26, 357–371. - PubMed
    1. Bird A.J., Evans-Galea,M., Blankman,E., Zhao,H., Luo,H., Winge,D.R. and Eide,D.J. (2000a) Mapping the DNA binding domain of the Zap1 zinc-responsive transcriptional activator. J. Biol. Chem., 275, 16160–16166. - PubMed
    1. Bird A.J., Zhui,H., Luo,H., Jensen,L.T., Srinivasan,C., Evans-Galea,M., Winge,D.R. and Eide,D.J. (2000b) A dual role for zinc fingers in both DNA binding and zinc sensing by the Zap1 transcriptional activator. EMBO J., 19, 3704–3713. - PMC - PubMed

Publication types

MeSH terms