

Cav1.3 (alpha1D) Ca2+ currents in neonatal outer hair cells of mice
- PMID: 14514878
- PMCID: PMC2343630
- DOI: 10.1113/jphysiol.2003.053256
Cav1.3 (alpha1D) Ca2+ currents in neonatal outer hair cells of mice
Abstract
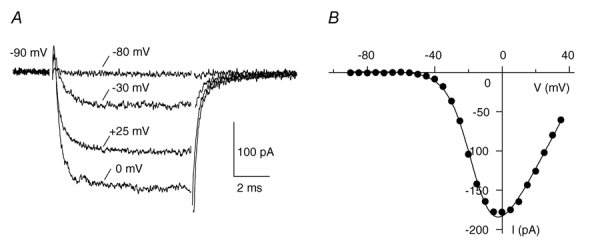
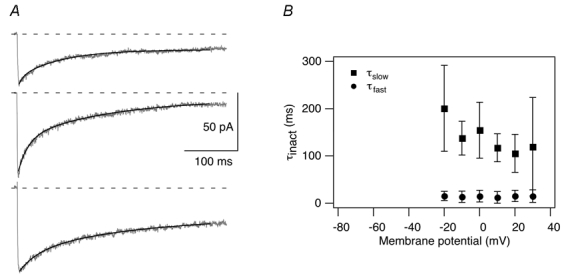
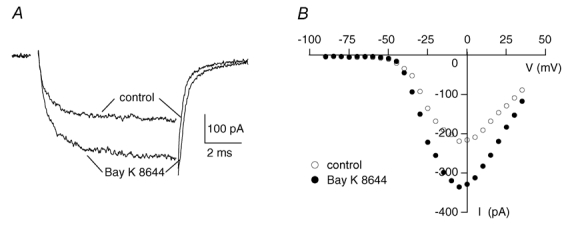
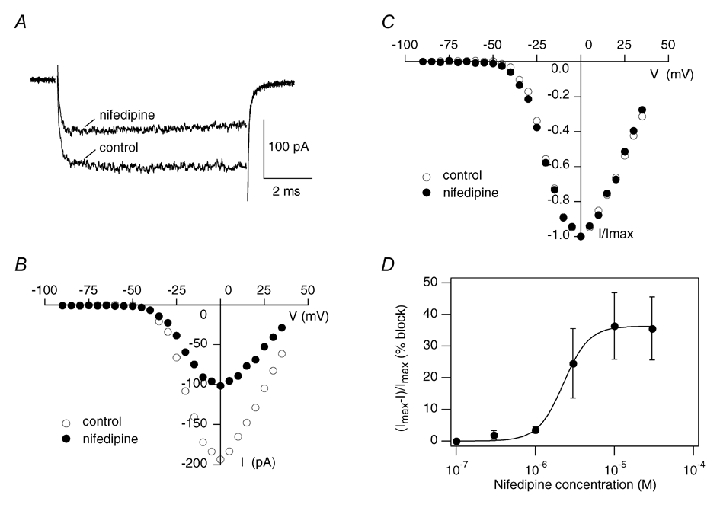
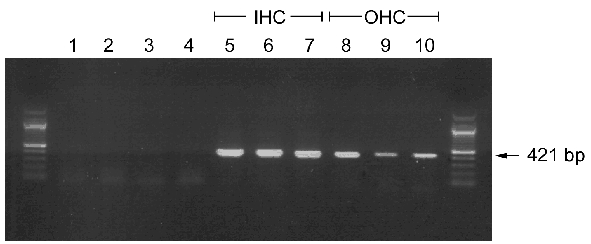
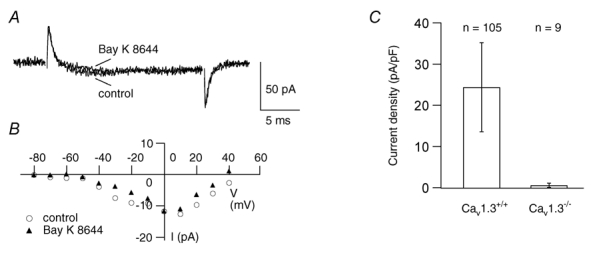
Outer hair cells (OHC) serve as electromechanical amplifiers that guarantee the unique sensitivity and frequency selectivity of the mammalian cochlea. It is unknown whether the afferent fibres connected to adult OHCs are functional. If so, voltage-activated Ca2+ channels would be required for afferent synaptic transmission. In neonatal OHCs, Ca2+ channels seem to play a role in maturation since OHCs from Cav1.3-deficient (Cav1.3-/-) mice degenerate shortly after the onset of hearing. We therefore studied whole-cell Ca2+ currents in outer hair cells aged between postnatal day 1 (P1) and P8. OHCs showed a rapidly activating inward current that was 1.8 times larger with 10 mM Ba2+ as charge carrier (IBa) than with equimolar Ca2+ (ICa). IBa started activating at -50 mV with Vmax = -1.9 +/- 6.9 mV, V0.5 = -15.0 +/- 7.1 mV and k = 8.2 +/- 1.1 mV (n = 34). The peak IBa showed negligible inactivation (3.6 % after 300 ms) whereas the ICa (10 mM Ca2+) was inactivated by 50.7 %. OHC IBa was reduced by 33.5 +/- 10.3 % (n = 14) with 10 microM nifedipine and increased to 178.5 +/- 57.8 % (n = 14) by 5 microM Bay K 8644. A dose-response curve for nifedipine revealed an IC50 of 2.3 microM, a Hill coefficient of 2.7 and a maximum block of 36 %. Average IBa density in OHCs was 24.4 +/- 10.8 pA pF-1 (n = 105) which is only 38 % of the value in inner hair cells. Single cell RT-PCR revealed expression of Cav1.3 in OHCs. In OHCs from Cav1.3-/- mice, Ba2+ current density was reduced to 0.6 +/- 0.5 pA pF-1 (n = 9) indicating that > 97 % of the Ca2+ channel current in OHCs flows through Cav1.3.
Figures


Similar articles
-
The CaV3.1 T-type Ca2+channel contributes to voltage-dependent calcium currents in rat outer hair cells.Brain Res. 2008 Mar 27;1201:68-77. doi: 10.1016/j.brainres.2008.01.058. Epub 2008 Feb 2. Brain Res. 2008. PMID: 18294617
-
Voltage-gated calcium channel currents in type I and type II hair cells isolated from the rat crista.J Neurophysiol. 2003 Jul;90(1):155-64. doi: 10.1152/jn.00244.2003. J Neurophysiol. 2003. PMID: 12843307
-
Effects of phenylalkylamines and benzothiazepines on Ca(v)1.3-mediated Ca2+ currents in neonatal mouse inner hair cells.Eur J Pharmacol. 2007 Nov 14;573(1-3):39-48. doi: 10.1016/j.ejphar.2007.06.050. Epub 2007 Jul 4. Eur J Pharmacol. 2007. PMID: 17651721
-
Tonotopy in calcium homeostasis and vulnerability of cochlear hair cells.Hear Res. 2019 May;376:11-21. doi: 10.1016/j.heares.2018.11.002. Epub 2018 Nov 16. Hear Res. 2019. PMID: 30473131 Free PMC article. Review.
-
Voltage-Gated Cav1 Channels in Disorders of Vision and Hearing.Curr Mol Pharmacol. 2015;8(2):143-8. doi: 10.2174/1874467208666150507104937. Curr Mol Pharmacol. 2015. PMID: 25966695 Free PMC article. Review.
Cited by
-
Ribbon synapses in zebrafish hair cells.Hear Res. 2015 Dec;330(Pt B):170-7. doi: 10.1016/j.heares.2015.04.003. Epub 2015 Apr 25. Hear Res. 2015. PMID: 25916266 Free PMC article. Review.
-
Pharmacology of L-type Calcium Channels: Novel Drugs for Old Targets?Curr Mol Pharmacol. 2015;8(2):110-22. doi: 10.2174/1874467208666150507105845. Curr Mol Pharmacol. 2015. PMID: 25966690 Free PMC article. Review.
-
RBP2 stabilizes slow Cav1.3 Ca2+ channel inactivation properties of cochlear inner hair cells.Pflugers Arch. 2020 Jan;472(1):3-25. doi: 10.1007/s00424-019-02338-4. Epub 2019 Dec 17. Pflugers Arch. 2020. PMID: 31848688 Free PMC article.
-
Thyroid hormone deficiency affects postnatal spiking activity and expression of Ca2+ and K+ channels in rodent inner hair cells.J Neurosci. 2007 Mar 21;27(12):3174-86. doi: 10.1523/JNEUROSCI.3965-06.2007. J Neurosci. 2007. PMID: 17376979 Free PMC article.
-
Hair cell maturation is differentially regulated along the tonotopic axis of the mammalian cochlea.J Physiol. 2020 Jan;598(1):151-170. doi: 10.1113/JP279012. Epub 2019 Dec 21. J Physiol. 2020. PMID: 31661723 Free PMC article.
References
-
- Art JJ, Crawford AC, Fettiplace R. Electrical resonance and membrane currents in turtle cochlear hair cells. Hear Res. 1986;22:31–36. - PubMed
-
- Barry PH. JPCalc, a software package for calculating liquid junction potential corrections in patch-clamp, intracellular, epithelial and bilayer measurements and for correcting junction potential measurements. J Neurosci Methods. 1994;1:107–116. - PubMed
-
- Bell DC, Butcher AJ, Berrow NS, Page KM, Brust PF, Nesterova A, Stauderman KA, Seabrook GR, Nurnberg B, Dolphin AC. Biophysical properties, pharmacology, and modulation of human, neuronal L-type (α1D, Cav1. 3) voltage-dependent calcium currents. J Neurophysiol. 2001;85:816–827. - PubMed
Publication types
MeSH terms
Substances
LinkOut - more resources
Full Text Sources
Molecular Biology Databases
Miscellaneous