

Functional characterization of a portion of the Moloney murine leukemia virus gag gene by genetic footprinting
- PMID: 14504385
- PMCID: PMC208817
- DOI: 10.1073/pnas.2034020100
Functional characterization of a portion of the Moloney murine leukemia virus gag gene by genetic footprinting
Abstract
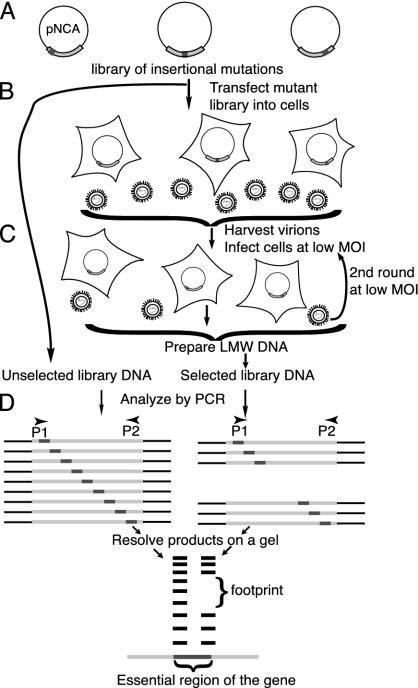
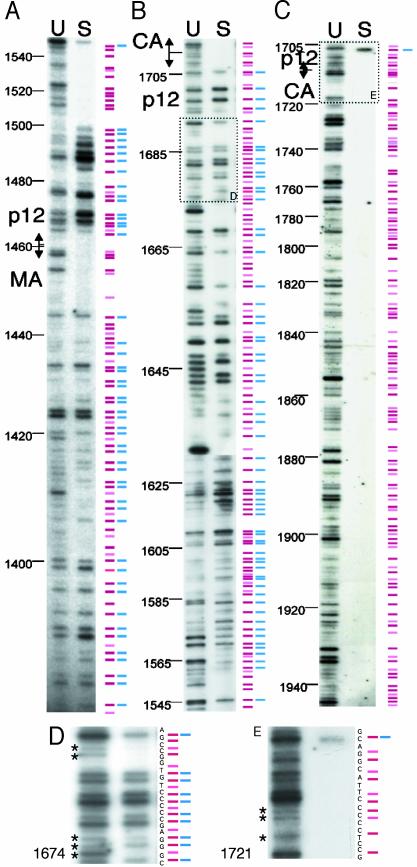
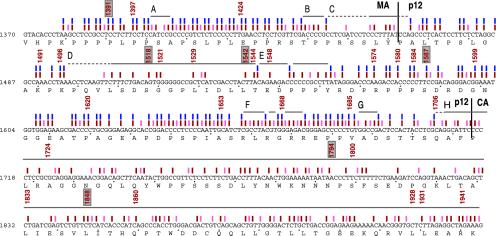
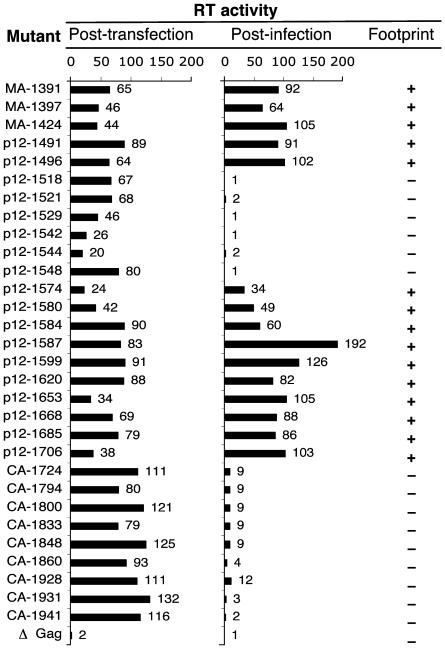
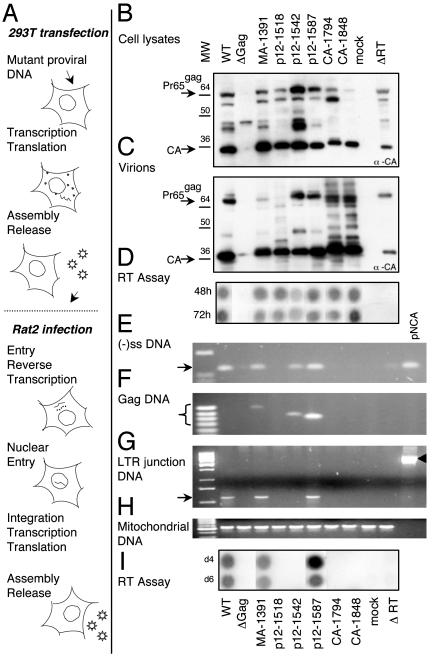
Retroviral Gag proteins perform important functions in viral assembly, but are also involved in other steps in the viral life cycle. Conventional mutational analysis has yielded considerable information about domains essential for these functions, yet many regions of gag remain uncharacterized. We used genetic footprinting, a technique that permits the generation and simultaneous analysis of large numbers of mutations, to perform a near-saturation mutagenesis and functional analysis of 639 nucleotides in the gag region of Moloney murine leukemia virus. We report here the resulting functional map defined by eight footprints representing regions of Moloney murine leukemia virus gag, some previously uncharacterized, that are essential for replication. We found that significant portions of matrix and p12 proteins were tolerant of insertions, in contrast to the N-terminal half of capsid, which was not. We analyzed 30 mutants from our library by using conventional methods to validate the footprints. Six of these mutants were characterized in detail, identifying the precise stage at which their replication is blocked. In addition to providing the most comprehensive functional map of a retroviral gag gene, our study demonstrates the abundance of information that can be gleaned by genetic footprinting of viral sequences.
Figures
Comment in
-
Genetic footprinting of a retroviral Gag gene suggests an important role in virus replication.Proc Natl Acad Sci U S A. 2003 Oct 14;100(21):11929-30. doi: 10.1073/pnas.2135539100. Epub 2003 Oct 6. Proc Natl Acad Sci U S A. 2003. PMID: 14530396 Free PMC article. No abstract available.
Similar articles
-
Genetic footprinting of a retroviral Gag gene suggests an important role in virus replication.Proc Natl Acad Sci U S A. 2003 Oct 14;100(21):11929-30. doi: 10.1073/pnas.2135539100. Epub 2003 Oct 6. Proc Natl Acad Sci U S A. 2003. PMID: 14530396 Free PMC article. No abstract available.
-
Mutations altering the moloney murine leukemia virus p12 Gag protein affect virion production and early events of the virus life cycle.EMBO J. 1999 Sep 1;18(17):4700-10. doi: 10.1093/emboj/18.17.4700. EMBO J. 1999. PMID: 10469649 Free PMC article.
-
Substitution mutations affecting a small region of the Moloney murine leukemia virus MA gag protein block assembly and release of virion particles.Virology. 1994 Nov 15;205(1):336-44. doi: 10.1006/viro.1994.1650. Virology. 1994. PMID: 7975229
-
Mutational analysis of stem-loops in the RNA packaging signal of the Moloney murine leukemia virus.Virology. 1998 Apr 25;244(1):133-45. doi: 10.1006/viro.1998.9090. Virology. 1998. PMID: 9581786
-
Capsid-targeted viral inactivation can eliminate the production of infectious murine leukemia virus in vitro.Virology. 2000 Feb 1;267(1):111-23. doi: 10.1006/viro.1999.0113. Virology. 2000. PMID: 10648188
Cited by
-
The gammaretroviral p12 protein has multiple domains that function during the early stages of replication.Retrovirology. 2012 Oct 4;9:83. doi: 10.1186/1742-4690-9-83. Retrovirology. 2012. PMID: 23035841 Free PMC article.
-
High-precision mapping of protein protein interfaces: an integrated genetic strategy combining en masse mutagenesis and DNA-level parallel analysis on a yeast two-hybrid platform.Nucleic Acids Res. 2007;35(16):e103. doi: 10.1093/nar/gkm563. Epub 2007 Aug 15. Nucleic Acids Res. 2007. PMID: 17702760 Free PMC article.
-
Construction and characterization of a fluorescently labeled infectious human immunodeficiency virus type 1 derivative.J Virol. 2004 Oct;78(19):10803-13. doi: 10.1128/JVI.78.19.10803-10813.2004. J Virol. 2004. PMID: 15367647 Free PMC article.
-
Interaction of moloney murine leukemia virus capsid with Ubc9 and PIASy mediates SUMO-1 addition required early in infection.J Virol. 2006 Jan;80(1):342-52. doi: 10.1128/JVI.80.1.342-352.2006. J Virol. 2006. PMID: 16352559 Free PMC article.
-
Structural Determinants of Virion Assembly and Release in the C Terminus of the Mason-Pfizer Monkey Virus Capsid Protein.J Virol. 2021 Sep 9;95(19):e0061521. doi: 10.1128/JVI.00615-21. Epub 2021 Jul 21. J Virol. 2021. PMID: 34287037 Free PMC article.
References
-
- Swanstrom, R. & Wills, J. W. (1997) in Retroviruses, eds. Coffin, J. M., Hughes, S. H. & Varmus, H. E. (Cold Spring Harbor Lab. Press, Plainview, NY), pp. 263–334.
-
- Quinonez, R., Sinha, I., Singh, I. R. & Sutton, R. E. (2003) Virology 307, 98–115. - PubMed
Publication types
MeSH terms
Substances
Grants and funding
LinkOut - more resources
Full Text Sources
