. 2003 Jul 23;23(16):6586-95.
doi: 10.1523/JNEUROSCI.23-16-06586.2003.

Drebrin-dependent actin clustering in dendritic filopodia governs synaptic targeting of postsynaptic density-95 and dendritic spine morphogenesis

Affiliations

Drebrin-dependent actin clustering in dendritic filopodia governs synaptic targeting of postsynaptic density-95 and dendritic spine morphogenesis

Hideto Takahashi et al. J Neurosci. .

Abstract

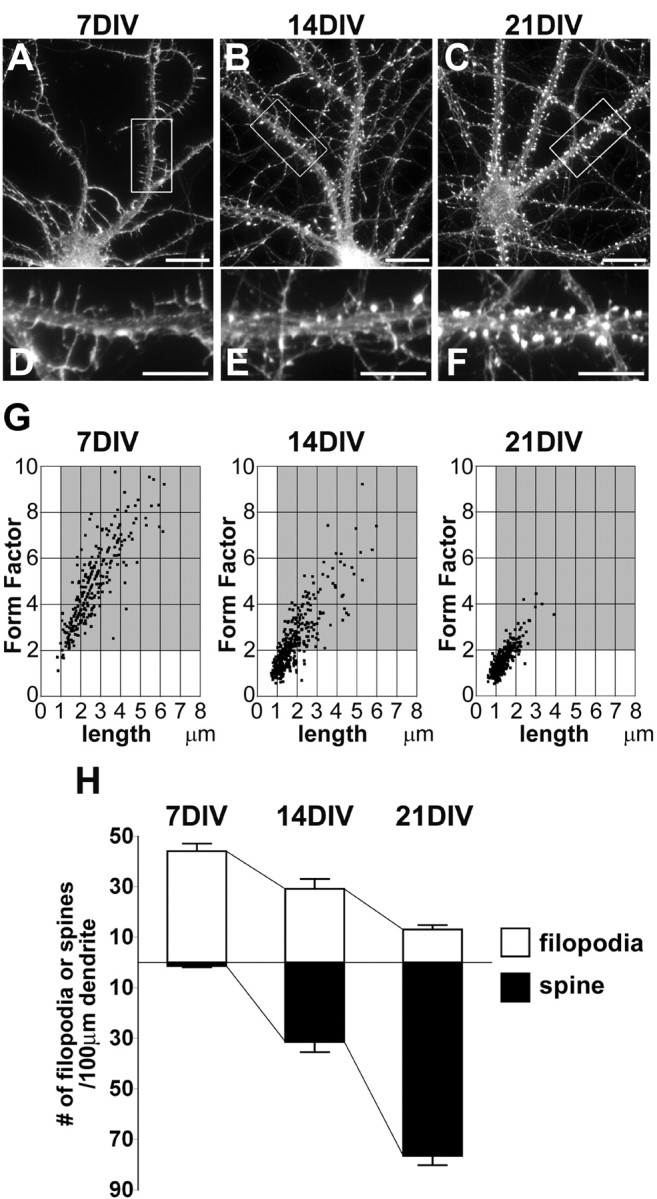
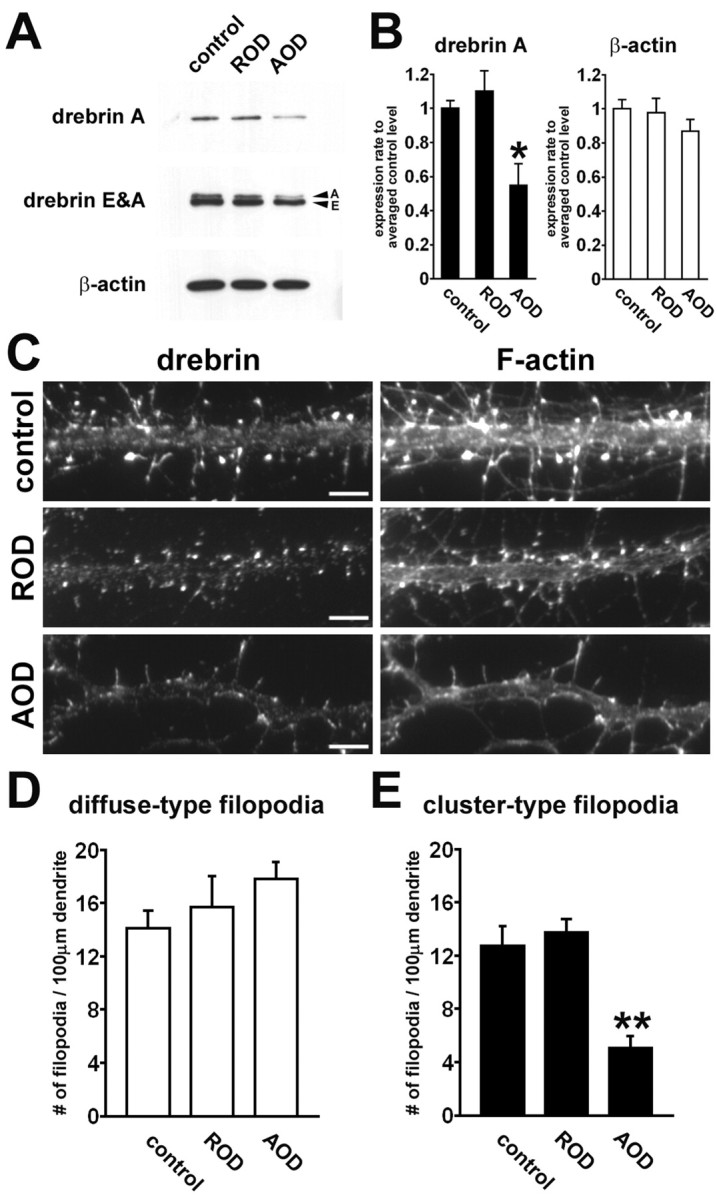
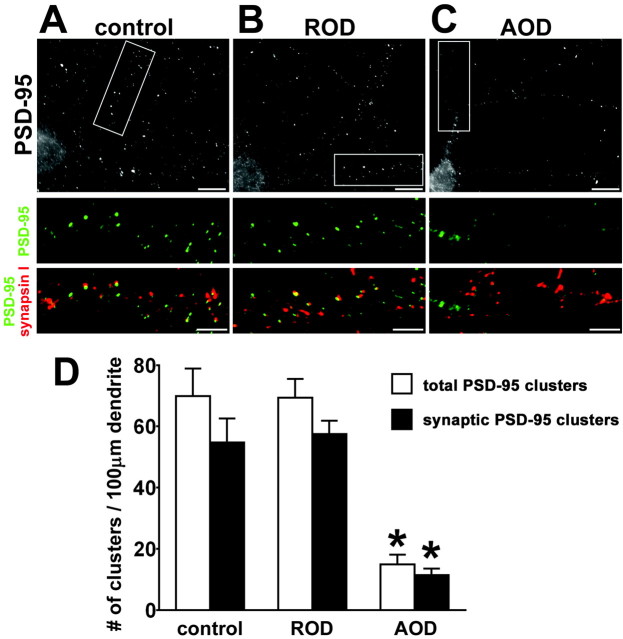
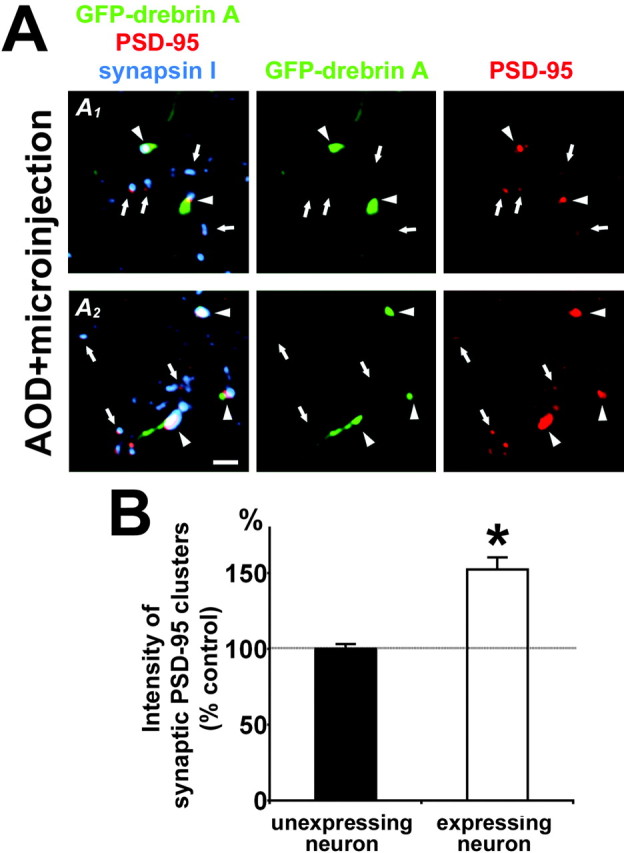
Dendritic spines have two major structural elements: postsynaptic densities (PSDs) and actin cytoskeletons. PSD proteins are proposed to regulate spine morphogenesis. However, other molecular mechanisms should govern spine morphogenesis, because the initiation of spine morphogenesis precedes the synaptic clustering of these proteins. Here, we show that synaptic clustering of drebrin, an actin-binding protein highly enriched in dendritic spines, governs spine morphogenesis. We immunocytochemically analyzed developing hippocampal neurons of low-density cultures. Filopodia-like dendritic protrusions were classified into two types: diffuse-type filopodia, which have diffuse distribution of drebrin, and cluster-type filopodia, which have drebrin clusters with filamentous actin (F-actin). Most cluster-type filopodia were synaptic filopodia. Postsynaptic drebrin clusters were found in both most synaptic filopodia and spines. Postsynaptic PSD-95 clusters, however, were found in only one-half of synaptic filopodia but in most spines. These data indicate that cluster-type filopodia are not mature spines but their precursors. Suppression of the upregulation of drebrin adult isoform (drebrin A) by antisense oligonucleotides against it attenuated synaptic clustering of PSD-95, as well as clustering of drebrin and F-actin. Furthermore, the restoration of drebrin A expression by injection of the expression vectors of drebrin A tagged with green fluorescent protein into the neurons treated with the antisense oligonucleotides induced synaptic reclustering of PSD-95 on clusters of the labeled drebrin A. These data indicated that the synaptic clustering of drebrin is necessary for that of PSD-95 in developing neurons. Together, these data suggest that synaptic clustering of drebrin is an essential step for spine morphogenesis.


Figures

Figure 1.
Figure 1.
Morphological changes in dendritic protrusions of cultured hippocampal neurons during development. A-F, F-actin staining of hippocampal neurons in low-density cultures at 7, 14, and 21 DIV. Boxed regions in A-C are shown below at higher magnification in D-F, respectively. At 7 DIV, filopodia-like protrusions are detected along dendrites (A, D). At 14 DIV, the dendritic protrusions show various shapes (B, E). The F-actin levels of the spine-like protrusions are higher than those of the filopodia-like protrusions (E). At 21 DIV, most protrusions exhibit mushroom-like or stubby shapes, which have enriched levels of F-actin (C, F). Scale bars: A-C, 10 μm;D-F, 5 μm. G, Scatter plots of dendritic protrusion length versus its form factor (length/width) at 7, 14, and 21 DIV. Dendritic filopodia were defined as headless protrusions in the gray area (length, >1 μm; form factor, >2) of each plot (n = 275, 445, and 387 dendritic protrusions for 7, 14, and 21 DIV, respectively). H, Mean densities of filopodia and spines at 7, 14, and 21 DIV. During development, filopodia density decreases, whereas spine density increases. Error bars indicate SEM. Histograms show means + SEM (n = 7, 9, and 8 dendrites for 7, 14, and 21 DIV, respectively).
Figure 2.
Figure 2.
Developmental changes in distributions of drebrin and F-actin in dendrites. Double labeling of dendrites for drebrin (green) and F-actin (red) at 7, 14, and 21 DIV. A-C, At 7 DIV, the staining of drebrin and F-actin shows a fibrous pattern at filopodia, although the drebrin staining is hardly detected at the tip of some filopodia (C, arrows). The discontinuous staining of them is observed at the submembranous regions of a dendritic shaft. Their hazy and flecked staining is also observed in the cytosol of the dendrite. D-F, At 14 DIV, drebrin and F-actin clusters (yellow) are colocalized at dendritic protrusions. At a dendritic shaft, overlap of drebrin and F-actin stainings is reduced. G-I, At 21 DIV, many drebrin clusters with F-actin (yellow) are observed at spines. Staining of F-actin without drebrin (I, red) is observed at a dendritic shaft. Scale bars: C (for A-C), F (for D-F), I (for G-I), 5 μm.
Figure 3.
Figure 3.
Two distinct types of dendritic filopodia based on drebrin staining. A, Double labeling of a typical dendrite at 14 DIV for drebrin and F-actin. Filopodium 1 shows diffuse staining of drebrin, and filopodium 3 shows the discontinuous staining of drebrin. However, drebrin clusters are observed at the middle region of filopodium 2 and at the basal region of filopodium 4. The drebrin clusters are overlapped with enriched F-actin area (arrows). Scale bar, 2 μm. B, Drebrin-immunofluorescent intensity along each filopodium in A. Each average intensity is indicated as a dotted line in each chart. A solid line in each chart indicates twice the average intensity of each filopodium. When a filopodium had a drebrin cluster whose maximum intensity exceeds the threshold of the solid line, it was defined as a cluster-type filopodium (right column). When a filopodium did not have such a drebrin cluster, it was classified as a diffuse-type filopodium (left column). AU, Arbitrary unit. C, Mean densities of diffuse-type and cluster-type filopodia at 7 DIV (n = 8 dendrites) and 14 DIV (n = 13 dendrites). The density of diffuse-type filopodia at 14 DIV is significantly lower than that at 7 DIV, whereas the density of cluster-type filopodia at 14 DIV is significantly higher than that at 7 DIV (*p < 0.01; **p < 0.0001; t test). Error bars indicate SEM. Histograms show means + SEM.
Figure 4.
Figure 4.
Presynaptic contact and cluster formation of drebrin in dendritic filopodia. Triple labeling of dendritic filopodia at 14 DIV for drebrin (green), F-actin (red), and synapsin I (blue). Most cluster-type filopodia are associated with synapsin I puncta, whereas most diffuse-type filopodia are not. Each percentage is shown as mean ± SEM (n = 11 dendrites; *p < 0.01; **p < 0.001; Scheffé's F test). Scale bars, 2 μm.
Figure 5.
Figure 5.
Proportions of PSD-95 and drebrin clusters in synaptic filopodia and spines. A, Triple labeling of a dendrite for PSD-95 (green), F-actin (red), and synapsin I (blue) at 14 DIV. PSD-95 clusters are observed in synaptic filopodia (arrowhead) and in synaptic spines (asterisks). Note that PSD-95 clusters are not detected in some synaptic filopodia (double arrowheads). B, Comparison between a percentage of PSD-95 clustering in synaptic filopodia and that in synaptic spines. PSD-95 clustering in synaptic filopodia is significantly less than that in synaptic spines (n = 11 dendrites; *p < 0.0001; t test). C, Triple labeling of a dendrite for drebrin (green), F-actin (red), and synapsin I (blue) at 14 DIV. Drebrin clusters are observed in synaptic filopodia (arrowheads) and in synaptic spines (asterisks). D, Comparison between a percentage of drebrin clustering in synaptic filopodia and that in synaptic spines. Drebrin clusters are observed in synaptic filopodia at the same proportion in synaptic spines (n = 11 dendrites; p = 0.99; t test). Scale bars: A, C, 5 μm. Error bars indicate SEM (B, D). Histograms show mean + SEM (B, D).
Figure 6.
Figure 6.
Changes of drebrin and F-actin distribution by antisense treatment. Cultured hippocampal neurons were treated with 10 μm AOD or ROD from 12 to 14 DIV. A, Western blots showing representative effect of AOD and ROD on expression of drebrin A, total drebrin (drebrin E and A), and β-actin. B, Densitometric analysis of the expression of drebrin A and β-actin. The AOD treatment significantly reduces drebrin A expression (n = 4 separate cultures; *p < 0.05, differences from control and ROD groups; Scheffé's F test). Neither AOD nor ROD has a significant effect on the expression of β-actin (n = 4 separate cultures; ANOVA; F = 1.00; p = 0.45). Error bars indicate SEM. Histograms show means + SEM. C, Double labeling of dendrites for drebrin (left) and F-actin (right) in control, ROD-treated, or AOD-treated neurons. The AOD treatment attenuates not only drebrin clustering but also F-actin clustering. Scale bars, 5 μm. D, E, Quantitative analysis of densities of diffuse-type (D) and cluster-type filopodia (E) in each group. The AOD treatment significantly reduces the density of cluster-type filopodia (n = 13, 10, 11 dendrites for control, ROD-treated, AOD-treated groups, respectively; **p < 0.001, differences from control and ROD groups; Scheffé's F test). Error bars indicate SEM. Histograms show means + SEM.
Figure 7.
Figure 7.
Synaptic clustering of PSD-95 is inhibited by the suppression of drebrin-A expression. Cultured hippocampal neurons were treated with 10 μm AOD or ROD from 12 to 14 DIV and were double labeled for PSD-95 and synapsin I. A-C, Top panels show grayscale images of PSD-95 immunolabeling of control (A), ROD-treated (B), and AOD-treated (C) neurons. Boxed regions in top panels are shown below at higher magnification as double labeling for PSD-95 (green) and synapsin I (red). Note that PSD-95 clusters are diminished in AOD-treated neurons, although PSD-95 distributions at cell soma are similar in each group. Scale bars: top panels, 10 μm; bottom panels, 5 μm. D, Quantitative analysis of densities of total and synaptic PSD-95 clusters in control, ROD-treated, or AOD-treated neurons. The AOD significantly reduces the densities of total and synaptic PSD-95 clusters (n = 10 dendrites for each group; *p < 0.0001, differences from control and ROD groups; Scheffé's F test). Error bars indicate SEM. Histograms show means + SEM.
Figure 8.
Figure 8.
Replenishment of drebrin A into AOD-treated neurons restores synaptic clustering of PSD-95. A, Two examples (A1, A2) of triple labeling of the neurons in AOD-treated cultures for GFP-drebrin A (green), PSD-95 (red), and synapsin I (blue). We injected GFP-tagged drebrin A expression vectors into AOD-treated neurons at 14 DIV using a microinjection method and immunostained the neurons for PSD-95 and synapsin I after 36 hr. GFP-drebrin A clusters are juxtaposed with synapsin I clusters. The PSD-95 clusters overlapping with GFP-drebrin A clusters (arrowheads) are larger and brighter than other PSD-95 clusters that do not overlap with GFP-drebrin A clusters (arrows). Scale bar, 2 μm. B, Quantitative analysis of averaged intensities of synaptic PSD-95 clusters in AOD-treated neurons expressing or not expressing GFP-drebrin A. The solid horizontal line shows 100% of control. PSD-95 clustering is enhanced by replenishment of GFP-drebrin A (n = 8 dendrites; *p < 0.0001; t test). Error bars indicate SEM. Histograms show means + SEM.

Similar articles

Cited by

References

    1. Allison DW, Gelfand VI, Spector I, Craig AM ( 1998) Role of actin in anchoring postsynaptic receptors in cultured hippocampal neurons: differential attachment of NMDA versus AMPA receptors. J Neurosci 18: 2423-2436. - PMC - PubMed
    1. Allison DW, Chervin AS, Gelfand VI, Craig AM ( 2000) Postsynaptic scaffolds of excitatory and inhibitory synapses in hippocampal neurons: maintenance of core components independent of actin filaments and microtubules. J Neurosci 20: 4545-4554. - PMC - PubMed
    1. Asada H, Uyemura K, Shirao T ( 1994) Actin-binding protein, drebrin, accumulates in submembranous regions in parallel with neuronal differentiation. J Neurosci Res 38: 149-159. - PubMed
    1. Colicos MA, Collins BE, Sailor MJ, Goda Y ( 2001) Remodeling of synaptic actin induced by photoconductive stimulation. Cell 107: 605-616. - PubMed
    1. Dailey ME, Smith SJ ( 1996) The dynamics of dendritic structure in developing hippocampal slices. J Neurosci 16: 2983-2994. - PMC - PubMed

Publication types

MeSH terms

LinkOut - more resources