

Envelope variants from women recently infected with clade A human immunodeficiency virus type 1 confer distinct phenotypes that are discerned by competition and neutralization experiments
- PMID: 12857914
- PMCID: PMC165268
- DOI: 10.1128/jvi.77.15.8448-8461.2003
Envelope variants from women recently infected with clade A human immunodeficiency virus type 1 confer distinct phenotypes that are discerned by competition and neutralization experiments
Abstract
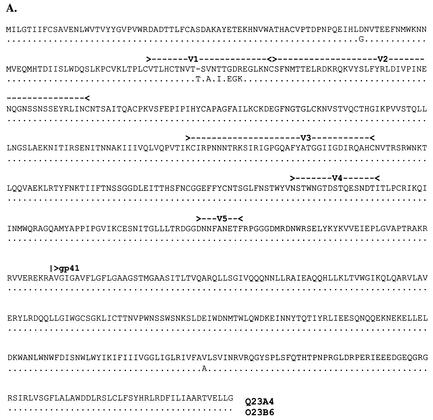
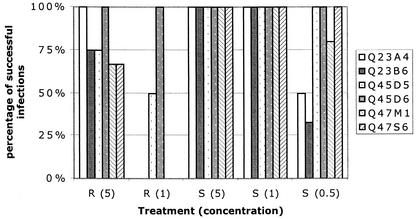
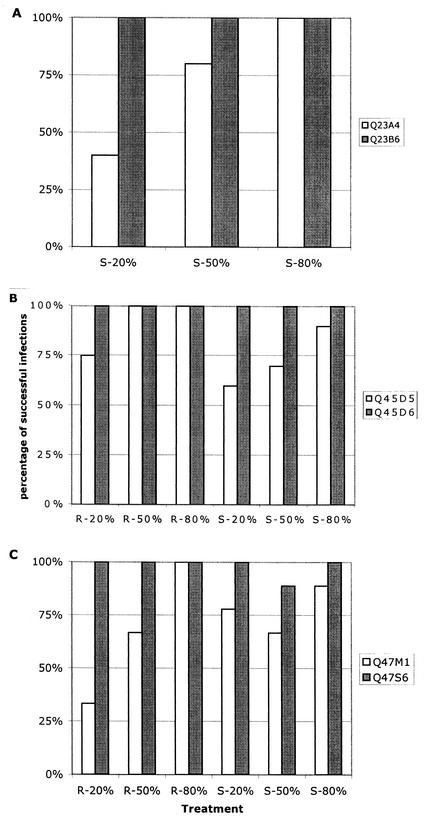
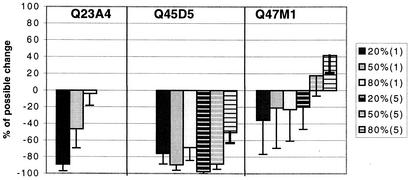
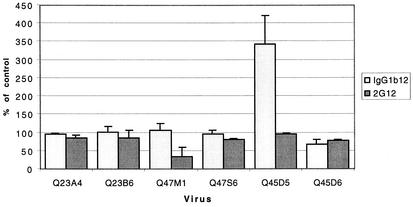
Women infected with clade A human immunodeficiency virus type 1 harbor a virus population that is genetically diverse in the envelope gene, a fact that contrasts with the homogeneous virus population identified in newly infected men. It is not known whether viral genetic diversity at this early stage of infection is manifested as phenotypic diversity. This is a significant question because phenotypic diversity in the viral population that establishes infection in women may have important implications for pathogenesis and therapeutic intervention. Thus, in this study we compared the biological properties of three pairs of chimeric viruses that contained envelope genes representative of variant groups in each of three infected women-Q23, Q45, and Q47. Envelope chimeras were evaluated for replication in stimulated and resting peripheral blood mononuclear cells alone and in competition, for coreceptor use, and for neutralization sensitivity. All viruses utilized CCR5 exclusively and had a non-syncytium-inducing phenotype on MT-2 cells and in primary culture. There were no significant differences in replication parameters between paired variants in individual cultures. However, in competition experiments, one chimera of each variant pair always dominated. The dominant virus from Q23 and Q47, but not from Q45, infected a significantly higher number of CCR5- and CD4-expressing GHOST cells than the weaker chimeras. Significantly, chimeric viruses from Q47 and Q45 showed markedly different neutralization sensitivity to antibodies to CCR5 and gp120, respectively. These data indicate that distinct envelope genotypes identified in clade A-infected women near seroconversion confer unique phenotypes that affect viral fitness and that may be due, in part, to different requirements for relative configuration of CD4 and CCR5 on infected cells.
Figures
Similar articles
-
V2 loop glycosylation of the human immunodeficiency virus type 1 SF162 envelope facilitates interaction of this protein with CD4 and CCR5 receptors and protects the virus from neutralization by anti-V3 loop and anti-CD4 binding site antibodies.J Virol. 2000 Aug;74(15):6769-76. doi: 10.1128/jvi.74.15.6769-6776.2000. J Virol. 2000. PMID: 10888615 Free PMC article.
-
Variants from the diverse virus population identified at seroconversion of a clade A human immunodeficiency virus type 1-infected woman have distinct biological properties.J Virol. 1999 Jul;73(7):5255-64. doi: 10.1128/JVI.73.7.5255-5264.1999. J Virol. 1999. PMID: 10364271 Free PMC article.
-
N-linked glycosylation of the V3 loop and the immunologically silent face of gp120 protects human immunodeficiency virus type 1 SF162 from neutralization by anti-gp120 and anti-gp41 antibodies.J Virol. 2004 Apr;78(7):3279-95. doi: 10.1128/jvi.78.7.3279-3295.2004. J Virol. 2004. PMID: 15016849 Free PMC article.
-
Coreceptor usage and biological phenotypes of HIV-1 isolates.Clin Chem Lab Med. 2002 Sep;40(9):911-7. doi: 10.1515/CCLM.2002.160. Clin Chem Lab Med. 2002. PMID: 12435108 Review.
-
Antibody-based inhibitors of HIV infection.Expert Opin Biol Ther. 2006 May;6(5):523-31. doi: 10.1517/14712598.6.5.523. Expert Opin Biol Ther. 2006. PMID: 16610981 Review.
Cited by
-
Solid-state nuclear magnetic resonance (NMR) spectroscopy of human immunodeficiency virus gp41 protein that includes the fusion peptide: NMR detection of recombinant Fgp41 in inclusion bodies in whole bacterial cells and structural characterization of purified and membrane-associated Fgp41.Biochemistry. 2011 Nov 22;50(46):10013-26. doi: 10.1021/bi201292e. Epub 2011 Oct 31. Biochemistry. 2011. PMID: 21985645 Free PMC article.
-
Modeling sequence evolution in acute HIV-1 infection.J Theor Biol. 2009 Nov 21;261(2):341-60. doi: 10.1016/j.jtbi.2009.07.038. Epub 2009 Aug 4. J Theor Biol. 2009. PMID: 19660475 Free PMC article. Review.
-
Comprehensive cross-clade neutralization analysis of a panel of anti-human immunodeficiency virus type 1 monoclonal antibodies.J Virol. 2004 Dec;78(23):13232-52. doi: 10.1128/JVI.78.23.13232-13252.2004. J Virol. 2004. PMID: 15542675 Free PMC article.
-
HIV-1 clade promoters strongly influence spatial and temporal dynamics of viral replication in vivo.J Clin Invest. 2005 Feb;115(2):348-58. doi: 10.1172/JCI22873. J Clin Invest. 2005. PMID: 15690084 Free PMC article.
References
-
- Alkhatib, G., C. Combadiere, C. C. Broder, Y. Feng, P. E. Kennedy, P. M. Murphy, and E. A. Berger. 1996. CC CKR5: a RANTES, MIP-1α, MIP-1β receptor as a fusion cofactor for macrophage-tropic HIV-1. Science 272:1955-1958. - PubMed
-
- Bailer, R. T., B. Lee, and L. J. Montaner. 2000. IL-13 and TNF-α inhibit dual-tropic HIV-1 in primary macrophages by reduction of surface expression of CD4, chemokine receptors CCR5, CXCR4 and post-entry viral gene expression. Eur. J. Immunol. 30:1340-1349. - PubMed
Publication types
MeSH terms
Substances
Associated data
- Actions
- Actions
- Actions
- Actions
Grants and funding
LinkOut - more resources
Full Text Sources
Molecular Biology Databases
Research Materials
