. 2003 Jul 2;23(13):5805-15.
doi: 10.1523/JNEUROSCI.23-13-05805.2003.

Four-dimensional migratory coordinates of GABAergic interneurons in the developing mouse cortex

Affiliations

Four-dimensional migratory coordinates of GABAergic interneurons in the developing mouse cortex

Eugenius S B C Ang Jr et al. J Neurosci. .

Abstract

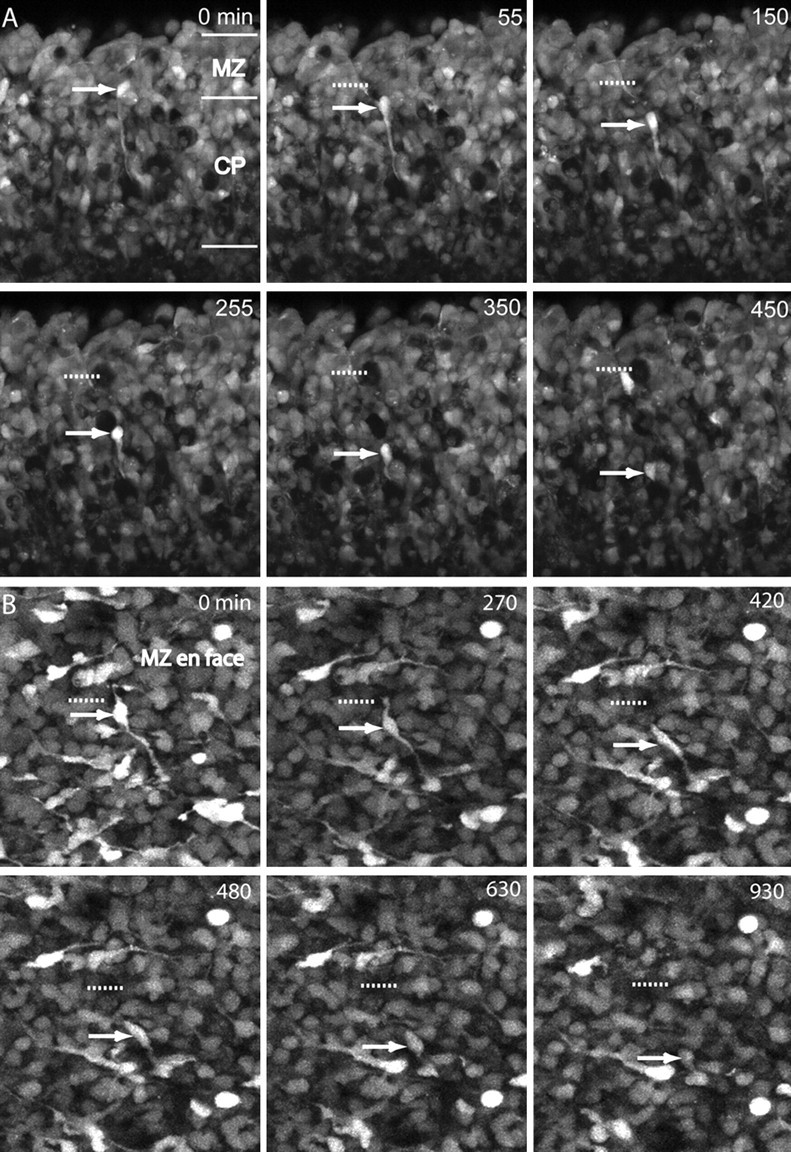
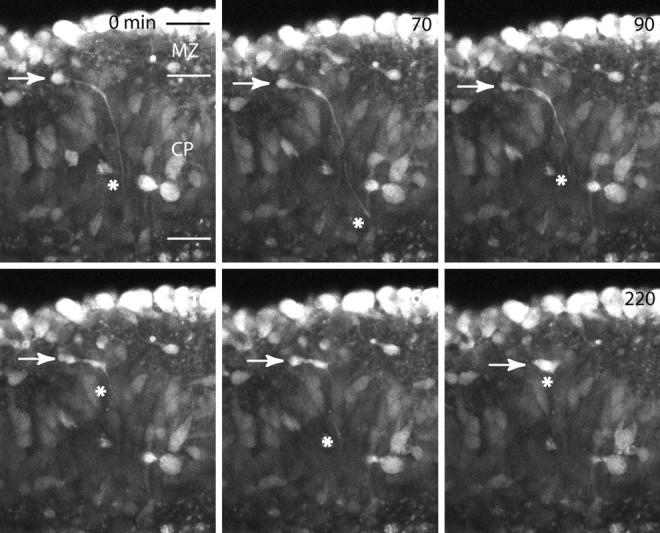
We have used time-lapse multiphoton microscopy to map the migration and settling pattern of GABAergic interneurons that originate in the ganglionic eminence of the ventral forebrain and incorporate into the neocortex of the cerebral hemispheres. Imaging of the surface of the cerebral hemispheres in both explant cultures and brains of living mouse embryos revealed that GABAergic interneurons migrating within the marginal zone originate from three different sources and migrate via distinct and independent streams. After reaching their areal destination, interneurons descend into the underlying cortex to assume positions with isochronically generated, radially derived neurons. The dynamics and pattern of cell migration in the marginal zone (see movies, available at www.jneurosci.org) suggest that the three populations of interneurons respond selectively to distinct local cues for directing their migration to the appropriate areas and layers of the neocortex. This approach opens a new avenue for study of normal and abnormal neuronal migration in their native environment and indicate that interneurons have specific programs for their areal and laminar deployment.


Figures

Figure 1.
Figure 1.
The telencephalic spread of ventrally derived interneurons occurs in three streams. Calbindin- immunopositive cells (white) in the MZ at various embryonic ages are shown in lateral views of whole-mount hemisphere preparations. ob, Position of olfactory bulb at the rostral end of the telencephalic vesicle. Theses series of images were taken from the pial surface. The brightly stained cells are at the surface of the telencephalon and are at the same depth as Cajal–Retzius cells. Similar experiments were performed with both calbindin and CR-50 to localize the relative depth of the calbindin interneurons imaged (data not shown). The less brightly stained cells are farther below the pial surface. Two streams of migrating interneurons emerge as early as E11.5 A, Stream I moves from a caudal to rostral and lateral to medial direction (arrow). Stream II moves in a rostral to caudal direction (arrowheads) and is confined to ventral cortical areas such as the poc. On E12 (B) and E12.5 (D), stream I extends over the lateral and rostral surface of the dorsal telencephalon, whereas stream II extends caudally over the ventral telencephalon. The boxed region in B is shown at a higher magnification in C. Each stream has two components (C): an initial wave of interneurons oriented toward the leading edge of the stream (small arrows) and a subsequent front of cells with multiple orientations (below dashed line). The boxed region inDis shown at a higher magnification inE. Streams I and II in E remain segregated from each other by a cell-sparse gap (between red dashed lines). A third stream (III) emerges just dorsal to the olfactory bulb at E13 (F) and moves in a rostral to caudal direction (arrows). D, Dorsal; M, medial; C, caudal; R, rostral; V, ventral; L, lateral (n = 4 brains for each age).
Figure 2.
Figure 2.
The MZ is stratified with superficial C–R cells and deeper-migrating interneurons. A, Tangential view of the MZ after immunohistochemical staining for the CR-50 reelin antibody. Some C–R cell processes are grouped along orthogonal axes forming a distinct rectilinear pattern. A coronal semithin section of an E15 cortex stained for CR-50 reelin (brown) and counterstained with toluidine blue (B) illustrates the stratification. Red arrowheads denote the deeper tangentially oriented migrating cells. Electron micrographs from tangential sections though the MZ demonstrate the large C–R cells (C) often with processes oriented orthogonal to each other. Smaller cells with migrating morphology (D) lie deep to the C–R cells. Scale bars (C, D), 10μm.
Figure 3.
Figure 3.
Phenotypic characterization of the superficial and deep strata of the MZ.A–F, En face confocal sections taken through superficial(1–7μm;A–C) and deep (8–15μm;D–F) levels of the E15 MZ. Cortical flaps were triple-stained for CellTracker Green (green), CR-50 (blue), and GABA, calretinin, calbindin, or Dlx-2 (red). Most of the cells in the superficial stratum of the MZ colabel for calretinin and CR-50 (A). These CR-50 cells, however, do not colabel with GABA (B) or with Dlx-2 (C). Rather, long axonal projections labeled with GABA, such as the one shown in B. Clusters of Dlx-2-labeled cells (C) did appear in this superficial stratum, but these cells did not colabel with CR-50. Tangentially oriented cells in the deep stratum of the MZ labeled with calbindin (D), GABA (E), and Dlx-2 (F). The deep stratum was relatively devoid of CR-50 labeling (D–F). Scale bars (C, F), 50 μm.
Figure 4.
Figure 4.
A multifaceted approach to imaging migrating cells. Four preparations constituted a multifaceted approach for imaging migrating cells: live in utero embryonic cortices (A), in situ whole brains (B), tangential cortical explants (C), and organotypic coronal slices (D). E, In utero en face view of the MZ at E16. F, Similar two-photon image of a CellTracker Green-stained MZ of an E14 in situ whole brain. G, Two-photon image of a CellTracker Green-stained MZ of an E15 in vitro tangential cortical explant. The multidirectional nature of the tangentially oriented cells found in the cortical explant (G) was confirmed in both the in situ whole brain (F) and in utero whole brain (E) preparations. Scale bars (E, G), 50 μm.
Figure 5.
Figure 5.
Comparison of the orientations of calretinin- and calbindin-positive neurons in the MZ. A, Distribution of calretinin-positive cell orientation in the MZ of E15 cortices (n = 883). B, Distribution of the orientation of calbindin-positive leading processes (n = 1809). In the case in which the leading process bifurcated or trifurcated, all processes were measured. Multiple orientations were measured for each population of cells (A, B); however, there was a predominance of cells oriented in the rostral, caudal, and lateral directions (A, B, D). Both the calretinin (A) and calbindin (B) measurements were taken from double-labeling experiments and therefore are from the same fields of view (fields of view, 20; brains, 4). Fields of view were randomly sampled across the entire dorsal telencephalic field. C, Double-labeling immunohistochemistry of the MZ of an E15 tangential cortical explant. Calretinin-positive cells are in red, and calbindin-positive cells are in green. The two populations of cells do not align along each other's processes (C); however, their overall distributions of orientation (D) are similar. This conclusion was confirmed using the Wald–Wolfowitz runs test (Z = 1.4878; p = 0.1368), which compares the relative shape of two distributions. C, Caudal; L, lateral; M, medial; R, rostral. Scale bar (C), 50 μm.
Figure 6.
Figure 6.
A, Time-lapse imaging of an E14 coronal slice in the MZ and CP stained with CellTracker Green. A downwardly migrating cell originating in the MZ (red arrow) moves toward its eventual position in the CP. The cell translocates its cell body toward the end of its leading process. The red dashed line shows the starting position of the cell body. The number in the top right corner is the time in minutes. B, Time lapse imaging of an E15 cortical flap stained with CellTracker Green. This series of images depicts another cell descending into the CP from the MZ from an en face view. The cell body (red arrow) follows its leading process into the depth of the explant flap, where it disappears from the field of view. The red dashed line shows the starting point of the cell body. Scale bars (A, B), 50 μm.
Figure 7.
Figure 7.
Time-lapse imaging of an E15 coronal slice stained with CellTracker Green. The cell (white arrow) migrates tangentially from left to right in the MZ. It bifurcates its leading process and sends a long process into the cortical plate (red asterisk). The leading process extends, retracts, extends, and retracts again over the course of the imaging session before it continues to migrate tangentially toward the right. The behavior noted is consistent with the hypothesis that the migrating cell uses its leading process to search the underlying CP before entering it. In this case, the cell continues to migrate tangentially without entering the CP. Scale bar, 50 μm.
Figure 8.
Figure 8.
Calbindin-positive cell distribution in mouse P7 cortex. Calbindin is labeled in green, and propidium iodide labels cell nuclei in red. A, Low-power views (10×) of the cortex. A prominent band of calbindin-positive cells occurs in middle layers of the cortex. B, Corresponding montage of sections taken at higher power (25×; white rectangle in A as an example). C, To quantify the distribution of calbindin-labeled cells in the cortex, a grid made up of eight equally sized bins was overlayed on top of images such as those shown in B. The percentage of labeled cells in each bin is depicted in C. Bin 1 was positioned starting at the pia, and bin 8 fell within the white matter. D, Comparison of the distribution of double-labeled calbindin and BrdU cells in the mouse P7 cortex. The y-axis represents the eight bins of a counting grid similar to that used in B and C. An inside-out settling pattern in the cortex occurs with calbindin-positive cells injected with BrdU on E13 (red), E15 (blue), and E17 (green) (n = 3 slices for each condition). Each field of view was composed of 10 optical sections imaged 1 μm apart.
Figure 9.
Figure 9.
Two models depicting the long-range migration of interneurons in the MZ and their eventual integration into the cortical plate with isochronically generated radial migrating neurons. A, Three predominant streams of migrating interneurons in the marginal zone of the developing cortex: I, a caudal to rostral and lateral to medial stream emerging from the caudal and medial ganglionic eminences (green and yellow, respectively); II, a rostral to caudal stream confined to the ventral telencephalon (orange); and III, a rostral to caudal stream emerging dorsal to the olfactory bulb (red). B, Model for local positioning of migrating interneurons. Radial glia (blue) support the radial migration of dorsally derived neurons (yellow) to the CP. In the MZ, the deep tangentially migrating interneurons (red) are located beneath the C–R cells (green). At the end of their local positioning within the MZ, migrating interneurons turn and incorporate into the CP using either radial glial cell processes or neuronal apical dendrites as guides. R, Rostral; C, caudal; V, ventral; D, dorsal; L, lateral; M, medial; RG, radial glia; SV, subventricular.

Similar articles

Cited by

References

    1. Alcantara S, Ferrer I, Soriano E ( 1993) Postnatal development of parvalbumin and calbindin D28K immunoreactivities in the cerebral cortex of the rat. Anat Embryol (Berl) 188: 63-73. - PubMed
    1. Alcantara S, de Lecea L, Del Rio JA, Ferrer I, Soriano E ( 1996) Transient colocalization of parvalbumin and calbindin D28k in the postnatal cerebral cortex: evidence for a phenotypic shift in developing nonpyramidal neurons. Eur J Neurosci 8: 1329-1339. - PubMed
    1. Anderson SA, Eisenstat DD, Shi L, Rubenstein JL ( 1997) Interneuron migration from basal forebrain to neocortex: dependence on Dlx genes. Science 278: 474-476. - PubMed
    1. Anderson SA, Marin O, Horn C, Jennings K, Rubenstein JL ( 2001) Distinct cortical migrations from the medial and lateral ganglionic eminences. Development 128: 353-363. - PubMed
    1. Angevine Jr JB, Sidman RL ( 1961) Autoradiographic study of cell migration during histogenesis of cerebral cortex in the mouse. Nature 192: 766-768. - PubMed

Publication types