. 2003 Jun 9;161(5):933-44.
doi: 10.1083/jcb.200211118.

Reactive oxygen species as essential mediators of cell adhesion: the oxidative inhibition of a FAK tyrosine phosphatase is required for cell adhesion

Affiliations

Reactive oxygen species as essential mediators of cell adhesion: the oxidative inhibition of a FAK tyrosine phosphatase is required for cell adhesion

Paola Chiarugi et al. J Cell Biol. .

Abstract

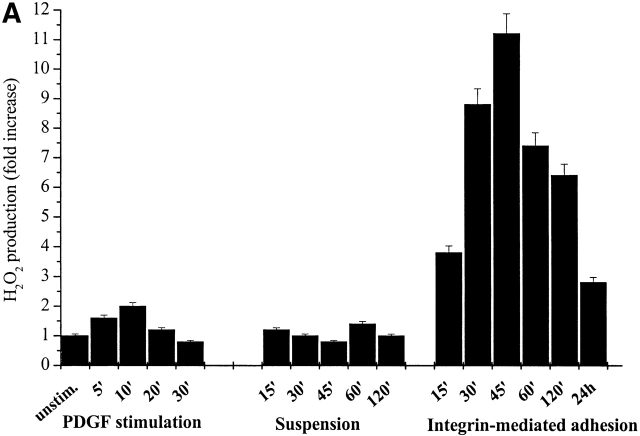
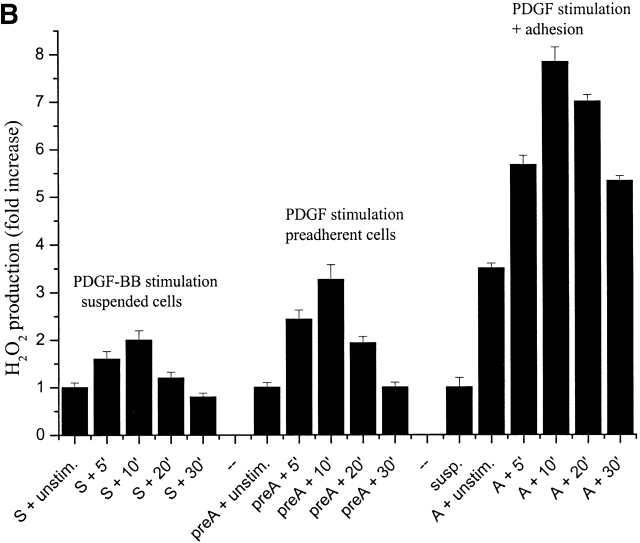
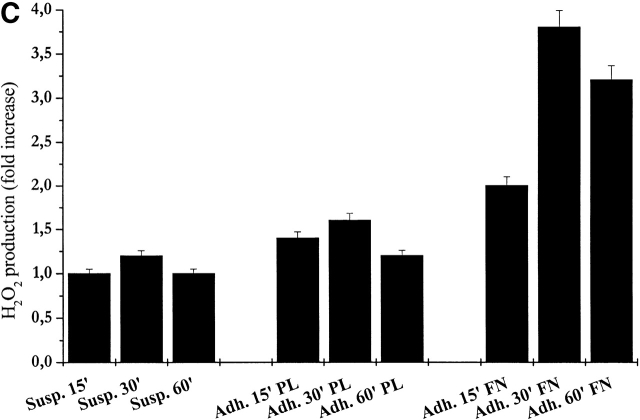
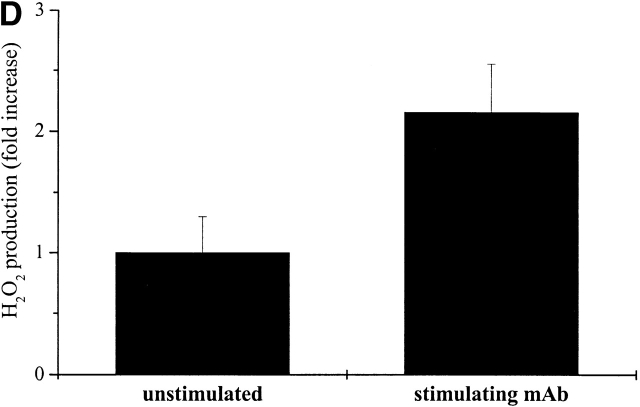
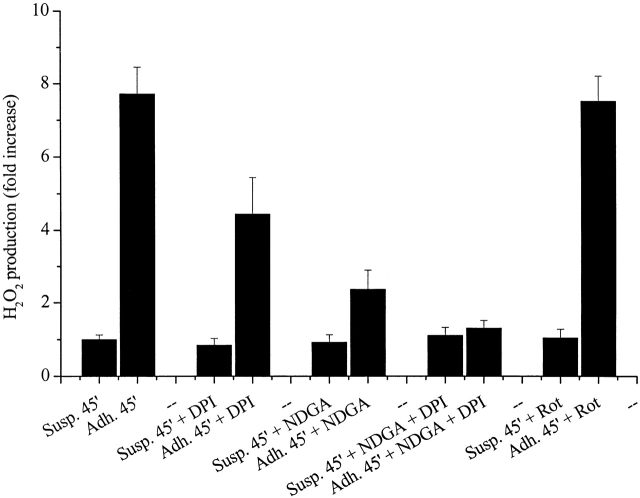
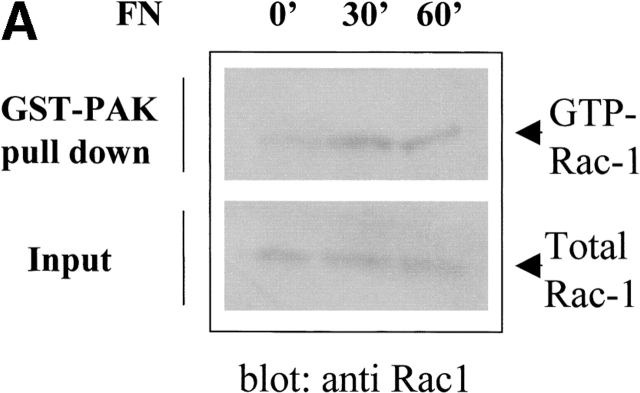
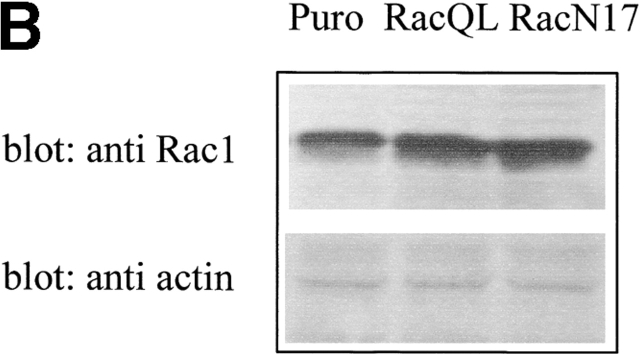
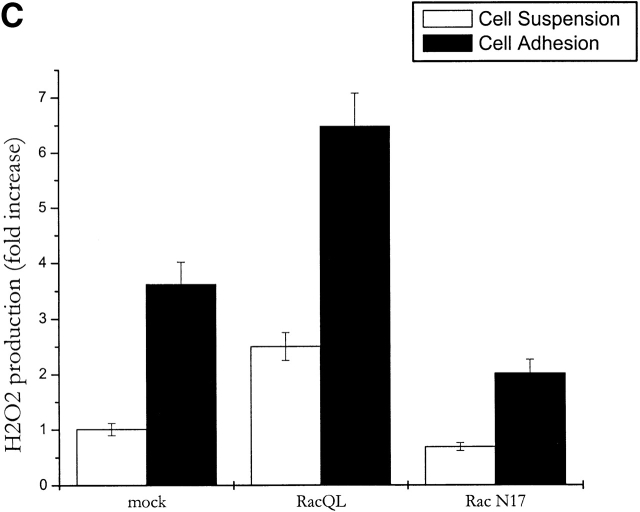
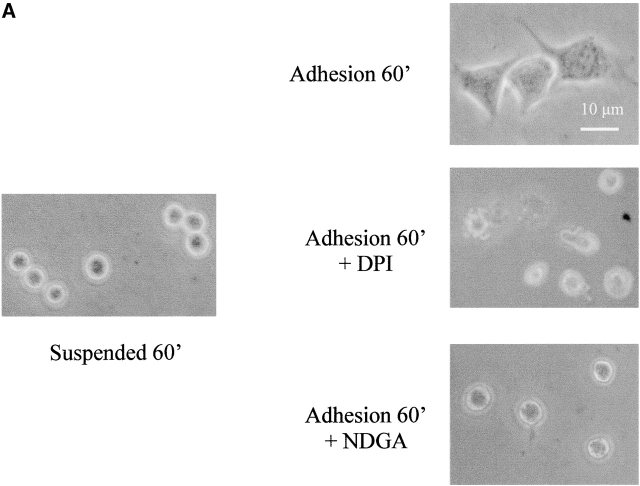
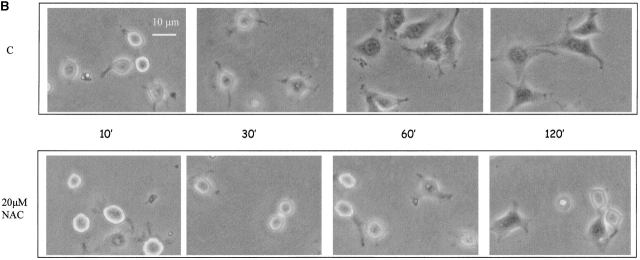
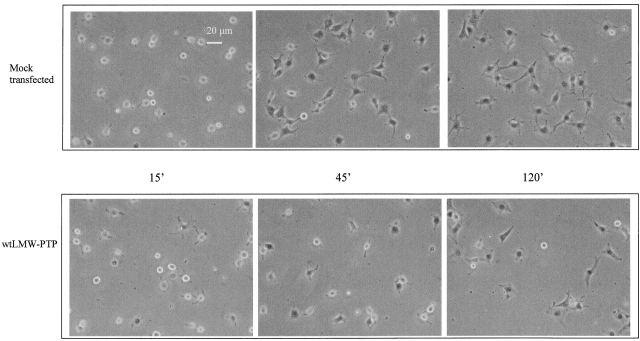
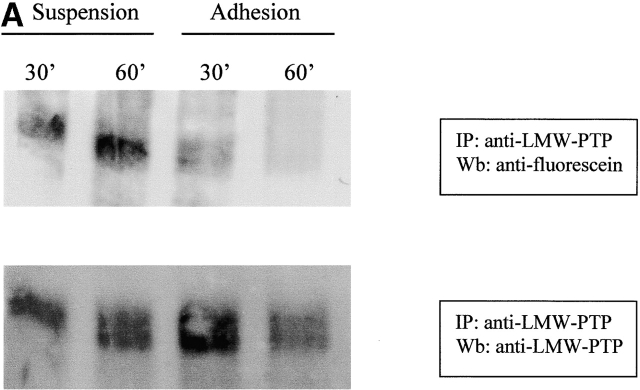
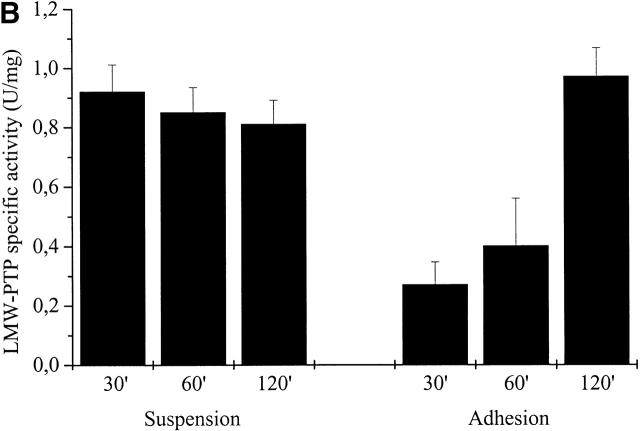
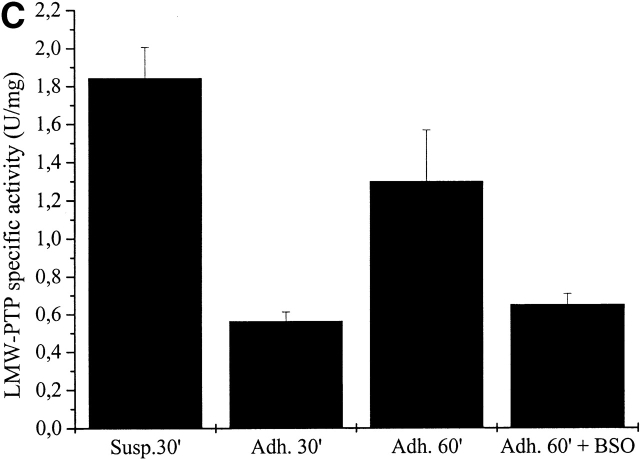
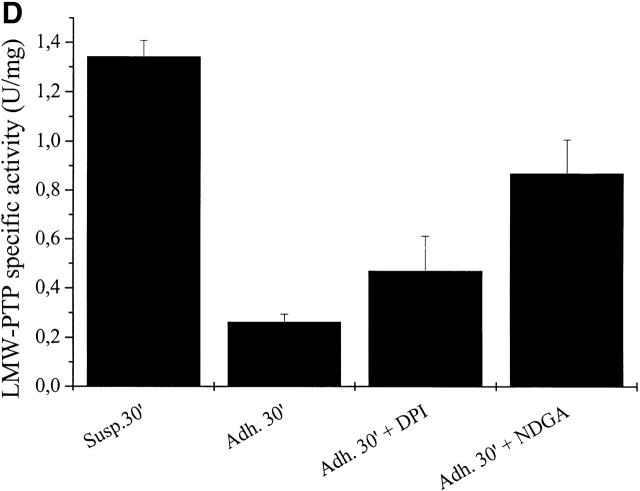
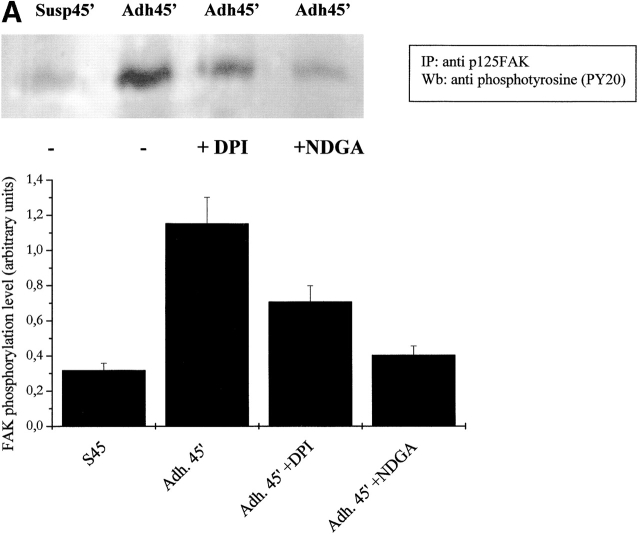
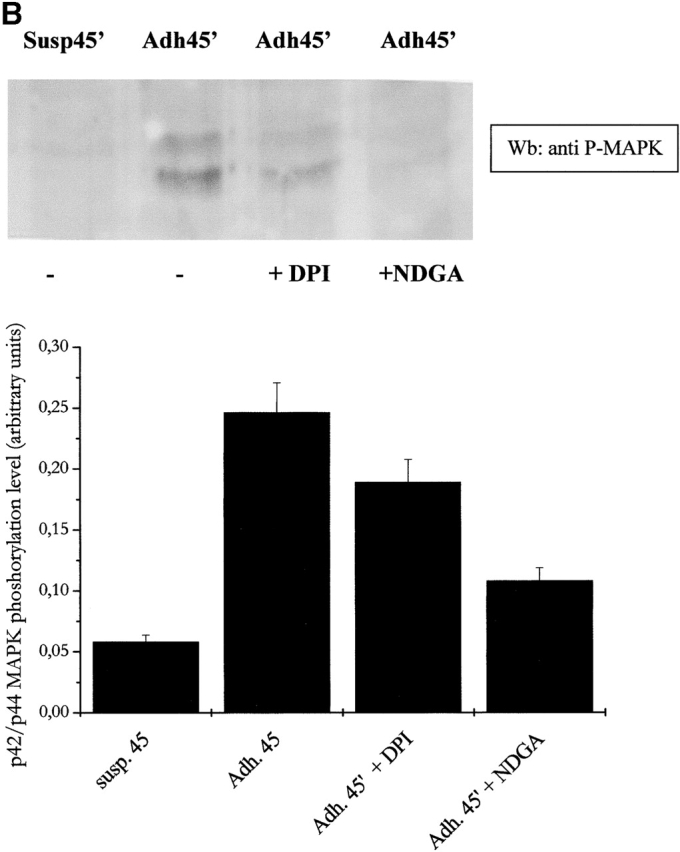
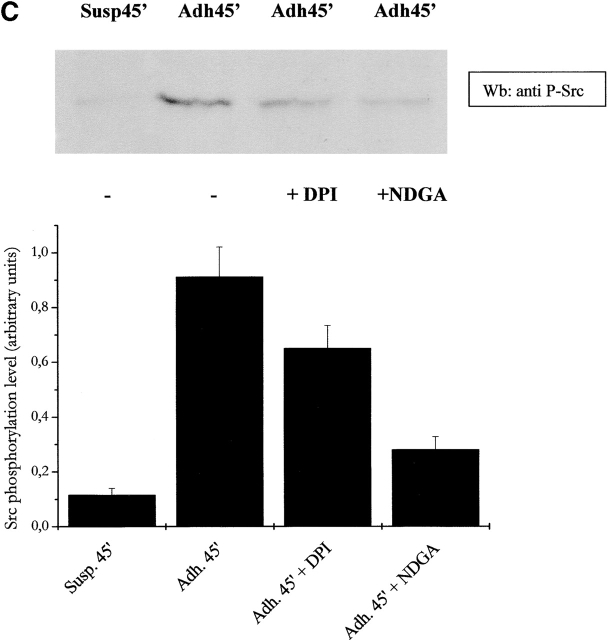
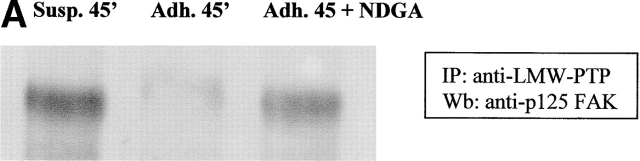
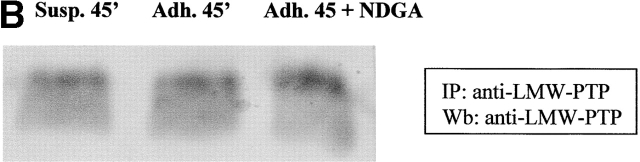
Signal transduction by reactive oxygen species (ROS; "redox signaling") has recently come into focus in cellular biology studies. The signaling properties of ROS are largely due to the reversible oxidation of redox-sensitive target proteins, and especially of protein tyrosine phosphatases, whose activity is dependent on the redox state of a low pKa active site cysteine. A variety of mitogenic signals, including those released by receptor tyrosine kinase (RTKs) ligands and oncogenic H-Ras, involve as a critical downstream event the intracellular generation of ROS. Signaling by integrins is also essential for the growth of most cell types and is constantly integrated with growth factor signaling. We provide here evidence that intracellular ROS are generated after integrin engagement and that these oxidant intermediates are necessary for integrin signaling during fibroblast adhesion and spreading. Moreover, we propose a synergistic action of integrins and RTKs for redox signaling. Integrin-induced ROS are required to oxidize/inhibit the low molecular weight phosphotyrosine phosphatase, thereby preventing the enzyme from dephosphorylating and inactivating FAK. Accordingly, FAK phosphorylation and other downstream events, including MAPK phosphorylation, Src phosphorylation, focal adhesion formation, and cell spreading, are all significantly attenuated by inhibition of redox signaling. Hence, we have outlined a redox circuitry whereby, upon cell adhesion, oxidative inhibition of a protein tyrosine phosphatase promotes the phosphorylation/activation and the downstream signaling of FAK and, as a final event, cell adhesion and spreading onto fibronectin.


Figures

Figure 1.
Figure 1.
Intracellular ROS level during cell adhesion. (A) 106 cells were serum starved for 24 h before detaching and maintained in suspension with gentle agitation for 30 min at 37°C. Cells were then kept in suspension during treatment with 30 ng/ml of PDGF-BB or either kept in suspension or plated on fibronectin precoated dishes for the indicated times. Hydrogen peroxide production was evaluated with DCF-DA. (B) Cells were treated as in A except for the analysis of preadherent cells, which have not been detached for presuspension but left on plastic dishes for 24 h in serum starvation. After 30 min of presuspension, cells have been either treated in suspension with 30 ng/ml of PDGF-BB (S) or seeded onto fibronectin-treated dishes simultaneously with PDGF-BB treatment (A) for the indicated times. In parallel, preadherent cells have been stimulated with 30 ng/ml of PDGF-BB (preA). Hydrogen peroxide was evaluated with DCF-DA. (C) Cells are treated as in A and then were kept in suspension (Susp.) or seeded onto plastic culture dishes precoated with polylysine (PL) or fibronectin (FN) for the indicated times. Hydrogen peroxide was evaluated with DCF-DA. (D) Cells were treated as in A except that they are maintained in suspension during treatment with anti–α5-integrin monoclonal antibodies (mAb). These data, normalized per protein content, are obtained by at least three independent experiments. Values are mean ± SD of triplicate samples.
Figure 1.
Figure 1.
Intracellular ROS level during cell adhesion. (A) 106 cells were serum starved for 24 h before detaching and maintained in suspension with gentle agitation for 30 min at 37°C. Cells were then kept in suspension during treatment with 30 ng/ml of PDGF-BB or either kept in suspension or plated on fibronectin precoated dishes for the indicated times. Hydrogen peroxide production was evaluated with DCF-DA. (B) Cells were treated as in A except for the analysis of preadherent cells, which have not been detached for presuspension but left on plastic dishes for 24 h in serum starvation. After 30 min of presuspension, cells have been either treated in suspension with 30 ng/ml of PDGF-BB (S) or seeded onto fibronectin-treated dishes simultaneously with PDGF-BB treatment (A) for the indicated times. In parallel, preadherent cells have been stimulated with 30 ng/ml of PDGF-BB (preA). Hydrogen peroxide was evaluated with DCF-DA. (C) Cells are treated as in A and then were kept in suspension (Susp.) or seeded onto plastic culture dishes precoated with polylysine (PL) or fibronectin (FN) for the indicated times. Hydrogen peroxide was evaluated with DCF-DA. (D) Cells were treated as in A except that they are maintained in suspension during treatment with anti–α5-integrin monoclonal antibodies (mAb). These data, normalized per protein content, are obtained by at least three independent experiments. Values are mean ± SD of triplicate samples.
Figure 2.
Figure 2.
The source of ROS during cell adhesion. (A) 106 cells were serum starved for 24 h before detaching and maintained in suspension with or without 5 μM DPI to block NADPH oxidase, 10 μM NDGA to block 5-LOX, or 5 μM rotenone (Rot) to block mitochondrial superoxide production. Then cells were kept in suspension or seeded on fibronectin-treated dishes. Hydrogen peroxide was evaluated with DCF-DA and normalized per protein content. Values are mean ± SD of triplicate samples.
Figure 3.
Figure 3.
Involvement of Rac-1 in adhesion-dependent redox signaling. (A) Rac-1 activation during fibroblast adhesion to fibronectin. NIH-3T3 cells were kept in suspension for 2 h in serum-free HBSS. After medium renewal, aliquots of 5 × 10⁵ cells were directly lysed or plated onto fibronectin-coated dishes for the indicated times. Adherent cells were then lysed and processed as described in Materials and methods. PAK-bound (GTP-loaded; top) and total (bottom) Rac-1 were quantified by anti Rac-1 Western blotting on GST-PAK pull downs and total cell lysates, respectively. (B) Expression of RacQL or RacN17 mutants in NIH-3T3 fibroblasts. NIH-3T3 were infected for 24 h with the indicated retroviral supernatants. Protein expression was verified by Western blot after 48 h of recovery. After anti-Rac immunoblotting, the filter was reprobed with an antiactin antiserum to control for equal protein loading in all the lanes. (C) Mock- and Rac-infected cells were serum starved for 24 h before detaching and maintained in suspension with gentle agitation for 30 min at 37°C. Cells were then kept in suspension or plated on fibronectin precoated dishes for 45 min. Hydrogen peroxide production was evaluated with DCF-DA and normalized per protein content. The infection efficiency in this experiment was ∼60%. Values are mean ± SD of triplicate samples.
Figure 3.
Figure 3.
Involvement of Rac-1 in adhesion-dependent redox signaling. (A) Rac-1 activation during fibroblast adhesion to fibronectin. NIH-3T3 cells were kept in suspension for 2 h in serum-free HBSS. After medium renewal, aliquots of 5 × 10⁵ cells were directly lysed or plated onto fibronectin-coated dishes for the indicated times. Adherent cells were then lysed and processed as described in Materials and methods. PAK-bound (GTP-loaded; top) and total (bottom) Rac-1 were quantified by anti Rac-1 Western blotting on GST-PAK pull downs and total cell lysates, respectively. (B) Expression of RacQL or RacN17 mutants in NIH-3T3 fibroblasts. NIH-3T3 were infected for 24 h with the indicated retroviral supernatants. Protein expression was verified by Western blot after 48 h of recovery. After anti-Rac immunoblotting, the filter was reprobed with an antiactin antiserum to control for equal protein loading in all the lanes. (C) Mock- and Rac-infected cells were serum starved for 24 h before detaching and maintained in suspension with gentle agitation for 30 min at 37°C. Cells were then kept in suspension or plated on fibronectin precoated dishes for 45 min. Hydrogen peroxide production was evaluated with DCF-DA and normalized per protein content. The infection efficiency in this experiment was ∼60%. Values are mean ± SD of triplicate samples.
Figure 4.
Figure 4.
ROS are mediators of cell adhesion. (A) 105 cells were serum starved for 24 h before detaching and maintained in suspension for 30 min at 37° with or without 5 μM DPI or 10 μM NDGA. Cells were then kept in suspension or seeded onto fibronectin-treated dishes for 60 min. Photographs of PFA-fixed cells were taken in a phase–contrast microscope. (B) The cells are treated as in A except that they are pretreated with 20 μM NAC (instead of NDGA or DPI) for 30 min in suspension. These experiments are representative of at least three others with similar results.
Figure 4.
Figure 4.
ROS are mediators of cell adhesion. (A) 105 cells were serum starved for 24 h before detaching and maintained in suspension for 30 min at 37° with or without 5 μM DPI or 10 μM NDGA. Cells were then kept in suspension or seeded onto fibronectin-treated dishes for 60 min. Photographs of PFA-fixed cells were taken in a phase–contrast microscope. (B) The cells are treated as in A except that they are pretreated with 20 μM NAC (instead of NDGA or DPI) for 30 min in suspension. These experiments are representative of at least three others with similar results.
Figure 5.
Figure 5.
LMW-PTP down-regulates cell adhesion to fibronectin. 3 × 10⁴ mock-transfected or wtLMW-PTP–overexpressing cells were seeded in serum-depleted medium, for the indicated times, onto fibronectin pretreated dishes. Photographs of PFA-fixed cells were taken in a phase–contrast microscope. This experiment is representative of at least three others with similar results.
Figure 6.
Figure 6.
LMW-PTP oxidation during cell adhesion. (A) 106 NIH-3T3 cells were serum starved for 24 h before detaching and maintained in suspension for 30 min at 37°. Cells were then kept in suspension or seeded onto fibronectin-treated dishes for 30 and 60 min. Cells were then lysed in RIPA buffer and treated with 5′-F-IAA. LMW-PTP was immunoprecipitated, and an antifluorescein immunoblotting was performed. The blot was then stripped and reprobed with anti–LMW-PTP antibodies for normalization. (B) 106 NIH-3T3 cells overexpressing wtLMW-PTP were treated as in A except that LMW-PTP was immunoprecipitated without 5′-IAF labeling, and a PTP activity assay was performed using PNPP as substrate. LMW-PTP activity is shown in U/mg. (C) 106 NIH-3T3 cells overexpressing wtLMW-PTP were treated as in B except that they were pretreated for 16 h with or without BSO in order to inhibit the synthesis of glutathione. (D) 106 NIH-3T3 cells overexpressing wtLMW-PTP were treated as in B except that they were pretreated for 30 min with or without 5 μM DPI or 10 μM NDGA in order to inhibit the synthesis of ROS. These data are representative of at least three independent experiments.
Figure 6.
Figure 6.
LMW-PTP oxidation during cell adhesion. (A) 106 NIH-3T3 cells were serum starved for 24 h before detaching and maintained in suspension for 30 min at 37°. Cells were then kept in suspension or seeded onto fibronectin-treated dishes for 30 and 60 min. Cells were then lysed in RIPA buffer and treated with 5′-F-IAA. LMW-PTP was immunoprecipitated, and an antifluorescein immunoblotting was performed. The blot was then stripped and reprobed with anti–LMW-PTP antibodies for normalization. (B) 106 NIH-3T3 cells overexpressing wtLMW-PTP were treated as in A except that LMW-PTP was immunoprecipitated without 5′-IAF labeling, and a PTP activity assay was performed using PNPP as substrate. LMW-PTP activity is shown in U/mg. (C) 106 NIH-3T3 cells overexpressing wtLMW-PTP were treated as in B except that they were pretreated for 16 h with or without BSO in order to inhibit the synthesis of glutathione. (D) 106 NIH-3T3 cells overexpressing wtLMW-PTP were treated as in B except that they were pretreated for 30 min with or without 5 μM DPI or 10 μM NDGA in order to inhibit the synthesis of ROS. These data are representative of at least three independent experiments.
Figure 7.
Figure 7.
ROS produced by cell adhesion affects FAK activation and downstream signals. (A) FAK activation analysis: 106 NIH-3T3 cells overexpressing wtLMW-PTP were serum starved for 24 h before detaching and maintained in suspension for 30 min at 37°C with or without 5 μM DPI or 10 μM NDGA. Then cells were either kept in suspension or seeded onto fibronectin-treated dishes for 45 min. Cells were then lysed in RIPA buffer, p125FAK was immunoprecipitated, and an antiphosphotyrosine immunoblotting was performed. The blot was then stripped and reprobed with anti-p125FAK antibodies for normalization by densitometric analysis. The bottom plot reports the activation ratio of p125FAK. (B and C) MAPK and Src kinase activation analysis: cells were treated as in A except that 10 μg of total lysates in RIPA buffer was used for an anti–phospho-MAPK immunoblot. The blot was then stripped and reprobed with anti-MAPK antibodies for normalization by densitometric analysis. The bottom plot reports the net activation of MAPK (B) or Src kinase (C). These data are representative of at least three independent experiments.
Figure 7.
Figure 7.
ROS produced by cell adhesion affects FAK activation and downstream signals. (A) FAK activation analysis: 106 NIH-3T3 cells overexpressing wtLMW-PTP were serum starved for 24 h before detaching and maintained in suspension for 30 min at 37°C with or without 5 μM DPI or 10 μM NDGA. Then cells were either kept in suspension or seeded onto fibronectin-treated dishes for 45 min. Cells were then lysed in RIPA buffer, p125FAK was immunoprecipitated, and an antiphosphotyrosine immunoblotting was performed. The blot was then stripped and reprobed with anti-p125FAK antibodies for normalization by densitometric analysis. The bottom plot reports the activation ratio of p125FAK. (B and C) MAPK and Src kinase activation analysis: cells were treated as in A except that 10 μg of total lysates in RIPA buffer was used for an anti–phospho-MAPK immunoblot. The blot was then stripped and reprobed with anti-MAPK antibodies for normalization by densitometric analysis. The bottom plot reports the net activation of MAPK (B) or Src kinase (C). These data are representative of at least three independent experiments.
Figure 8.
Figure 8.
ROS produced by cell adhesion affects LMW-PTP binding to p125FAK. (A) 106 NIH-3T3 cells overexpressing wtLMW-PTP were serum starved for 24 h before detaching and maintained in suspension for 30 min at 37°C with or without 10 μM NDGA. Then, cells were either kept in suspension or seeded onto fibronectin-treated dishes for 45 min. Cells were then lysed in RIPA buffer, and LMW-PTP was immunoprecipitated, and an anti-p125FAK immunoblotting was performed. The blot was then stripped and reprobed with anti–LMW-PTP antibodies for normalization (B). These data are representative of at least three independent experiments.
Figure 8.
Figure 8.
ROS produced by cell adhesion affects LMW-PTP binding to p125FAK. (A) 106 NIH-3T3 cells overexpressing wtLMW-PTP were serum starved for 24 h before detaching and maintained in suspension for 30 min at 37°C with or without 10 μM NDGA. Then, cells were either kept in suspension or seeded onto fibronectin-treated dishes for 45 min. Cells were then lysed in RIPA buffer, and LMW-PTP was immunoprecipitated, and an anti-p125FAK immunoblotting was performed. The blot was then stripped and reprobed with anti–LMW-PTP antibodies for normalization (B). These data are representative of at least three independent experiments.

Similar articles

Cited by

References

    1. Abo, A., E. Pick, A. Hall, N. Totty, C.G. Teahan, and A.W. Segal. 1991. Activation of the NADPH oxidase involves the small GTP-binding protein p21rac1. Nature. 353:668–670. - PubMed
    1. Bae, Y.S., S.W. Kang, M.S. Seo, I.C. Baines, E. Tekle, P.B. Chock, and S.G. Rhee. 1997. Epidermal growth factor (EGF)-induced generation of hydrogen peroxide. Role in EGF receptor-mediated tyrosine phosphorylation. J. Biol. Chem. 272:217–221. - PubMed
    1. Brakebusch, C., D. Bouvard, F. Stanchi, T. Sakai, and R. Fassler. 2002. Integrins in invasive growth. J. Clin. Invest. 109:999–1006. - PMC - PubMed
    1. Bucciantini, M., P. Chiarugi, P. Cirri, L. Taddei, M. Stefani, G. Raugei, P. Nordlund, and G. Ramponi. 1999. The low Mr phosphotyrosine protein phosphatase behaves differently when phosphorylated at Tyr131 or Tyr132 by Src kinase. FEBS Lett. 456:73–78. - PubMed
    1. Caselli, A., R. Marzocchini, G. Camici, G. Manao, G. Moneti, G. Pieraccini, and G. Ramponi. 1998. The inactivation mechanism of low molecular weight phosphotyrosine-protein phosphatase by H2O2. J. Biol. Chem. 273:32554–32560. - PubMed

Publication types

MeSH terms