Yeast Lsm1p-7p/Pat1p deadenylation-dependent mRNA-decapping factors are required for brome mosaic virus genomic RNA translation
- PMID: 12773554
- PMCID: PMC156131
- DOI: 10.1128/MCB.23.12.4094-4106.2003
Yeast Lsm1p-7p/Pat1p deadenylation-dependent mRNA-decapping factors are required for brome mosaic virus genomic RNA translation
Abstract
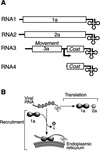
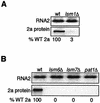
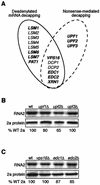
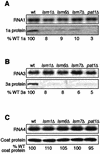
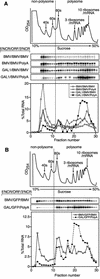
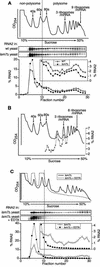
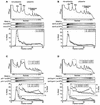
Previously, we used the ability of the higher eukaryotic positive-strand RNA virus brome mosaic virus (BMV) to replicate in yeast to show that the yeast LSM1 gene is required for recruiting BMV RNA from translation to replication. Here we extend this observation to show that Lsm1p and other components of the Lsm1p-Lsm7p/Pat1p deadenylation-dependent mRNA decapping complex were also required for translating BMV RNAs. Inhibition of BMV RNA translation was selective, with no effect on general cellular translation. We show that viral genomic RNAs suitable for RNA replication were already distinguished from nonreplication templates at translation, well before RNA recruitment to replication. Among mRNA turnover pathways, only factors specific for deadenylated mRNA decapping were required for BMV RNA translation. Dependence on these factors was not only a consequence of the nonpolyadenylated nature of BMV RNAs but also involved the combined effects of the viral 5' and 3' noncoding regions and 2a polymerase open reading frame. High-resolution sucrose density gradient analysis showed that, while mutating factors in the Lsm1p-7p/Pat1p complex completely inhibited viral RNA translation, the levels of viral RNA associated with ribosomes were only slightly reduced in mutant yeast. This polysome association was further verified by using a conditional allele of essential translation initiation factor PRT1, which markedly decreased polysome association of viral genomic RNA in the presence or absence of an LSM7 mutation. Together, these results show that a defective Lsm1p-7p/Pat1p complex inhibits BMV RNA translation primarily by stalling or slowing the elongation of ribosomes along the viral open reading frame. Thus, factors in the Lsm1p-7p/Pat1p complex function not only in mRNA decapping but also in translation, and both translation and recruitment of BMV RNAs to viral RNA replication are regulated by a cell pathway that transfers mRNAs from translation to degradation.
Figures


Similar articles
-
Host deadenylation-dependent mRNA decapping factors are required for a key step in brome mosaic virus RNA replication.J Virol. 2006 Jan;80(1):246-51. doi: 10.1128/JVI.80.1.246-251.2006. J Virol. 2006. PMID: 16352549 Free PMC article.
-
Interactions between brome mosaic virus RNAs and cytoplasmic processing bodies.J Virol. 2007 Sep;81(18):9759-68. doi: 10.1128/JVI.00844-07. Epub 2007 Jul 3. J Virol. 2007. PMID: 17609284 Free PMC article.
-
Purification and analysis of the decapping activator Lsm1p-7p-Pat1p complex from yeast.Methods Enzymol. 2008;448:41-55. doi: 10.1016/S0076-6879(08)02603-7. Methods Enzymol. 2008. PMID: 19111170
-
Mechanisms and control of mRNA decapping in Saccharomyces cerevisiae.Annu Rev Biochem. 2000;69:571-95. doi: 10.1146/annurev.biochem.69.1.571. Annu Rev Biochem. 2000. PMID: 10966469 Review.
-
Brome mosaic virus RNA replication: revealing the role of the host in RNA virus replication.Annu Rev Phytopathol. 2003;41:77-98. doi: 10.1146/annurev.phyto.41.052002.095717. Epub 2003 Mar 10. Annu Rev Phytopathol. 2003. PMID: 12651962 Review.
Cited by
-
Regulation of stress granules and P-bodies during RNA virus infection.Wiley Interdiscip Rev RNA. 2013 May-Jun;4(3):317-31. doi: 10.1002/wrna.1162. Epub 2013 Apr 3. Wiley Interdiscip Rev RNA. 2013. PMID: 23554219 Free PMC article. Review.
-
LSm1-7 complexes bind to specific sites in viral RNA genomes and regulate their translation and replication.RNA. 2010 Apr;16(4):817-27. doi: 10.1261/rna.1712910. Epub 2010 Feb 24. RNA. 2010. PMID: 20181739 Free PMC article.
-
Interplay between viruses and host mRNA degradation.Biochim Biophys Acta. 2013 Jun-Jul;1829(6-7):732-41. doi: 10.1016/j.bbagrm.2012.12.003. Epub 2012 Dec 26. Biochim Biophys Acta. 2013. PMID: 23274304 Free PMC article. Review.
-
Characterization of a novel 5' subgenomic RNA3a derived from RNA3 of Brome mosaic bromovirus.J Virol. 2006 Dec;80(24):12357-66. doi: 10.1128/JVI.01207-06. Epub 2006 Sep 27. J Virol. 2006. PMID: 17005659 Free PMC article.
-
The Lsm1-7-Pat1 complex promotes viral RNA translation and replication by differential mechanisms.RNA. 2015 Aug;21(8):1469-79. doi: 10.1261/rna.052209.115. Epub 2015 Jun 19. RNA. 2015. PMID: 26092942 Free PMC article.
References
-
- Ahlquist, P. 1992. Bromovirus RNA replication and transcription. Curr. Opin. Genet. Dev. 2:71-76. - PubMed
-
- Ahlquist, P., R. Dasgupta, and P. Kaesberg. 1981. Near identity of 3- RNA secondary structure in bromoviruses and cucumber mosaic virus. Cell 23:183-189. - PubMed
-
- Andino, R., N. Boddeker, D. Silvera, and A. V. Gamarnik. 1999. Intracellular determinants of picornavirus replication. Trends Microbiol. 7:76-82. - PubMed
-
- Ausubel, F. M., R. Brent, R. E. Kingston, D. D. Moore, J. G. Seidman, J. A. Smith, and K. Struhl (ed.). 1987. Current protocols in molecular biology. John Wiley & Sons, Inc., New York, N.Y.
Publication types
MeSH terms
Substances
Grants and funding
LinkOut - more resources
Full Text Sources
Other Literature Sources
Molecular Biology Databases
