. 2003 Jun;121(6):599-614.
doi: 10.1085/jgp.200308788.

Negative charges in the transmembrane domains of the HERG K channel are involved in the activation- and deactivation-gating processes

Affiliations

Negative charges in the transmembrane domains of the HERG K channel are involved in the activation- and deactivation-gating processes

Jie Liu et al. J Gen Physiol. 2003 Jun.

Abstract

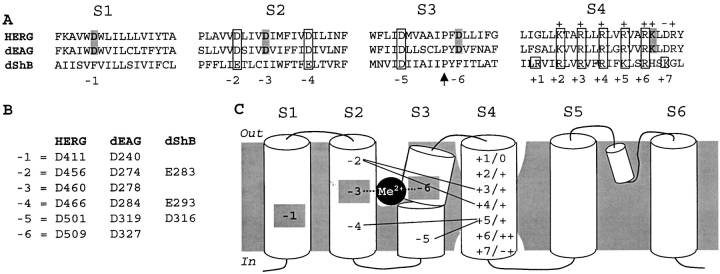
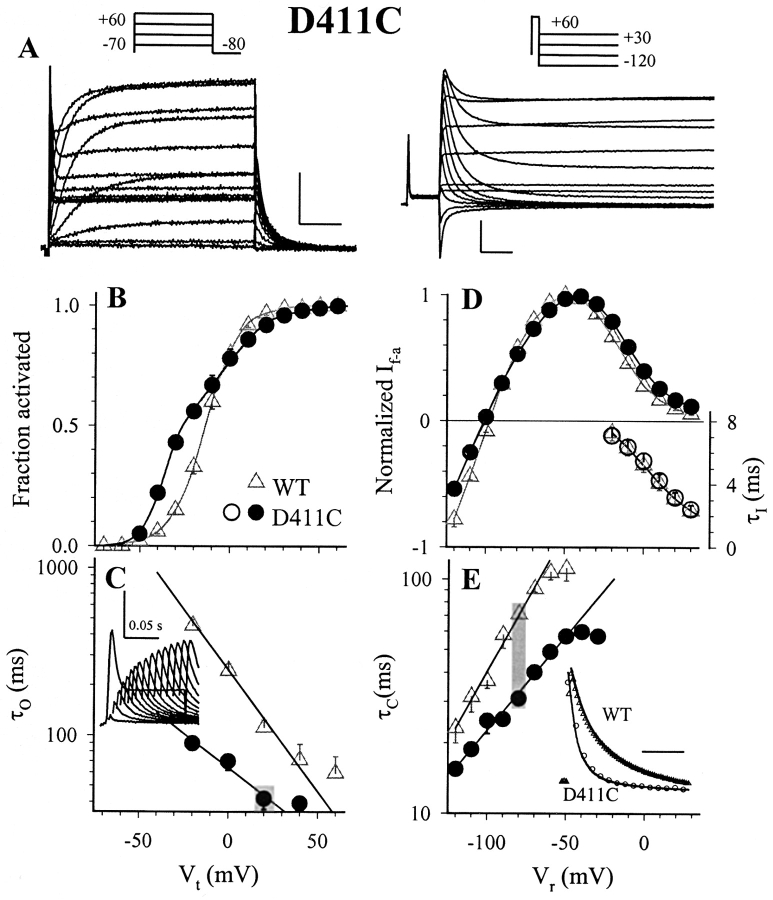
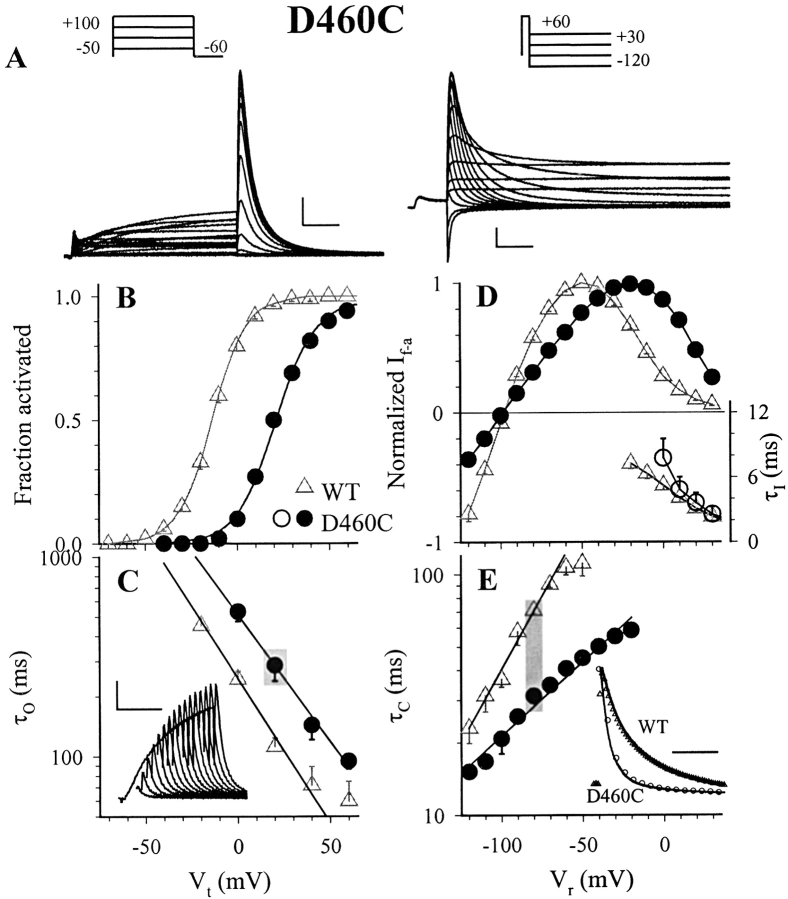
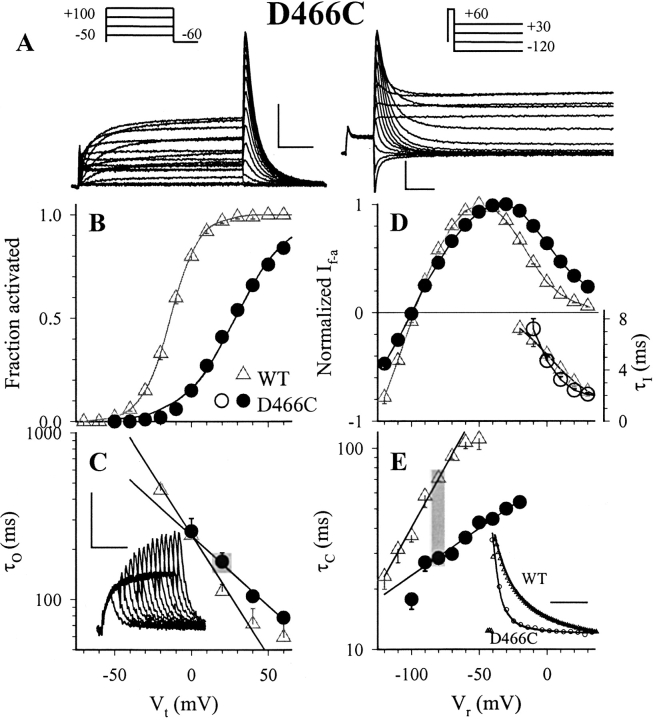
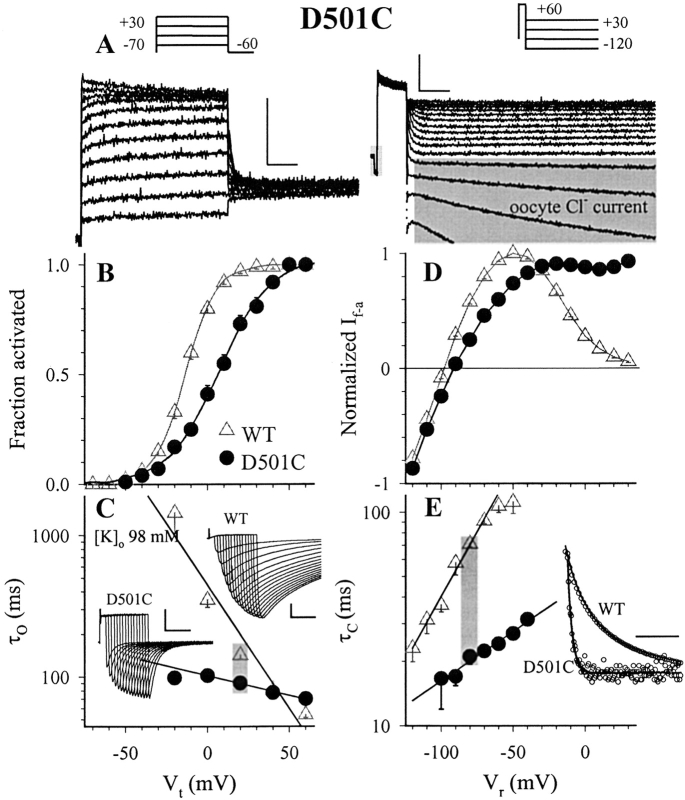
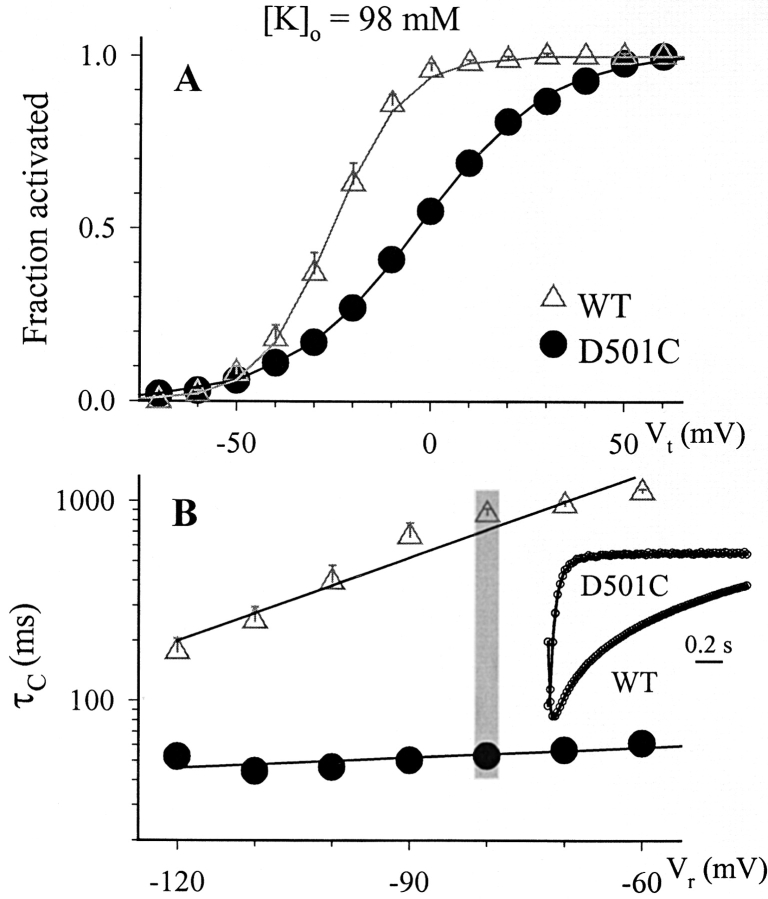
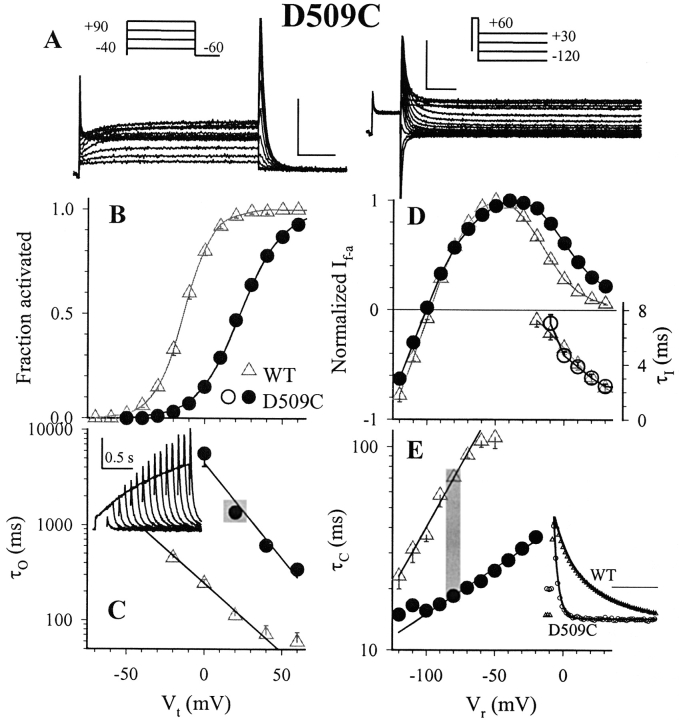
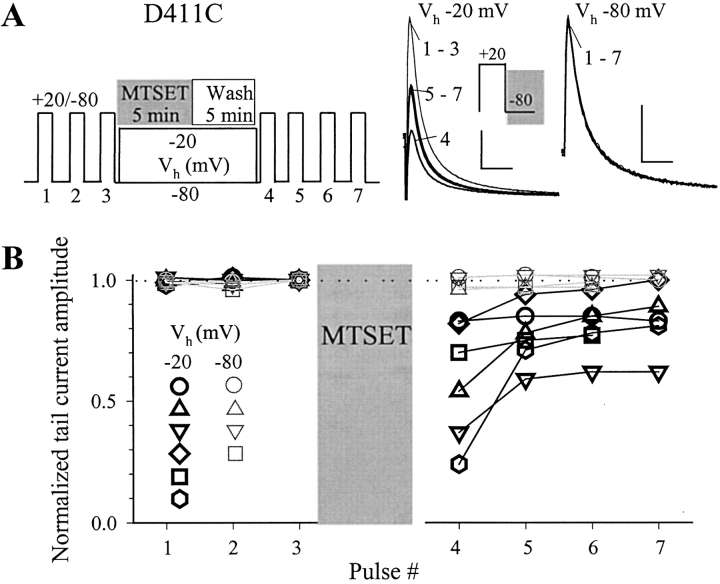
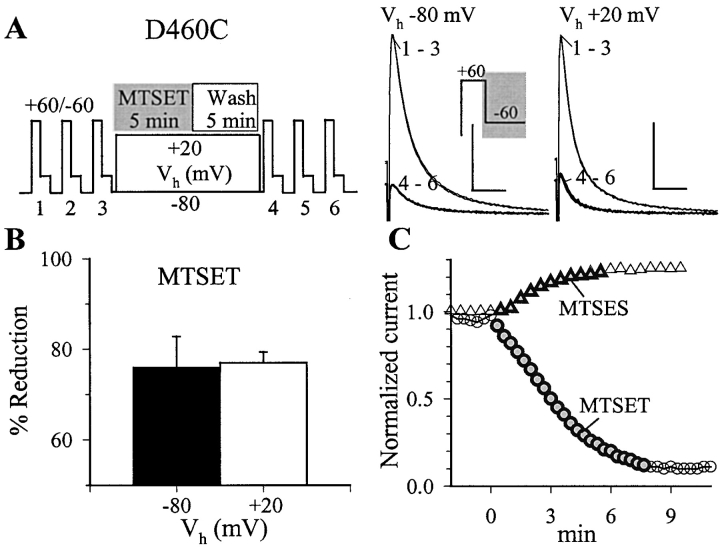
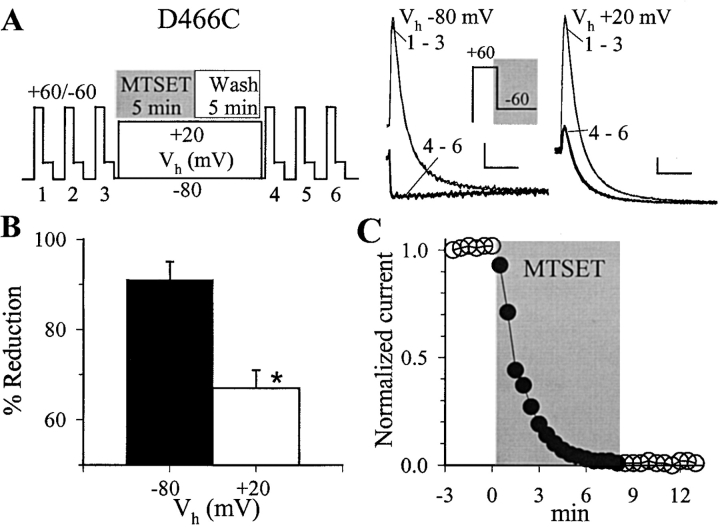
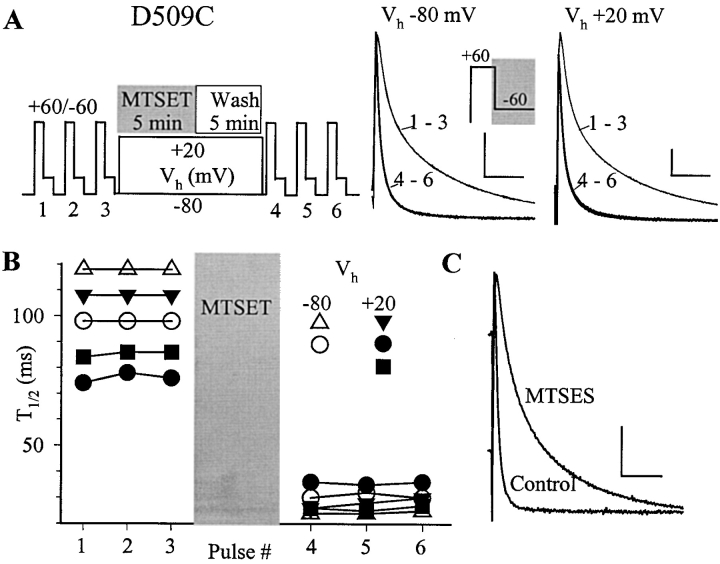
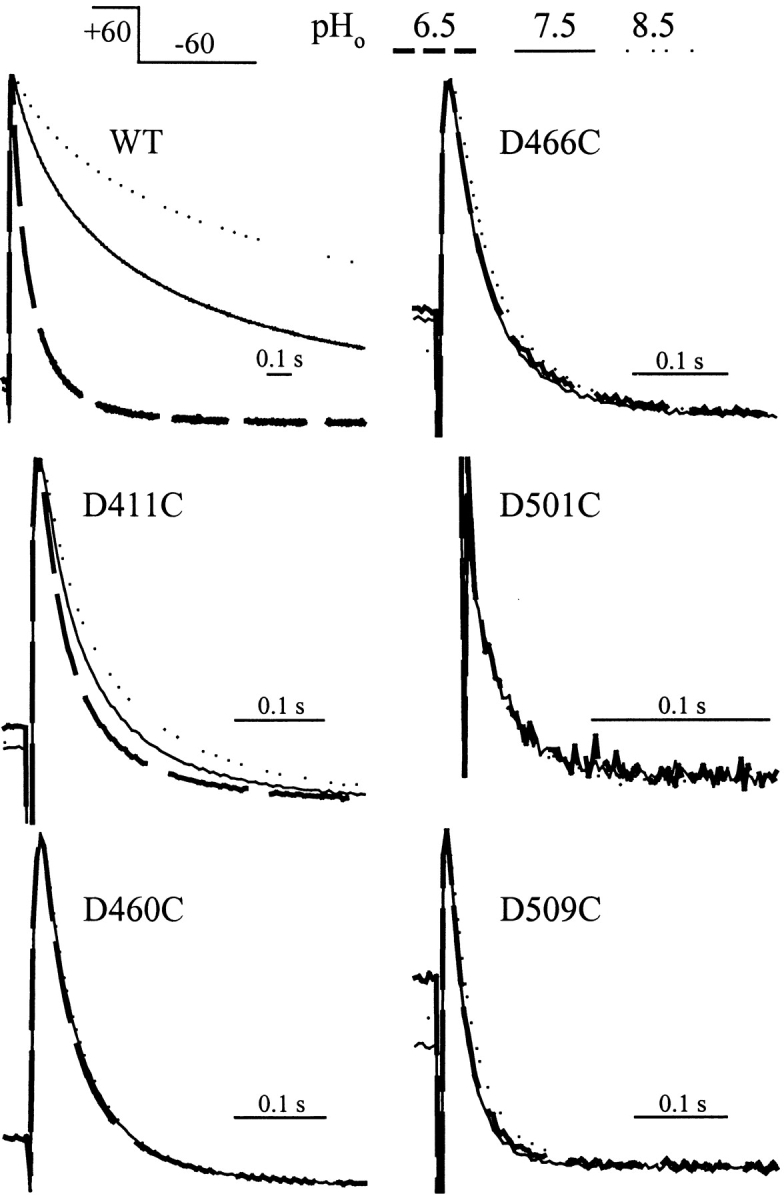
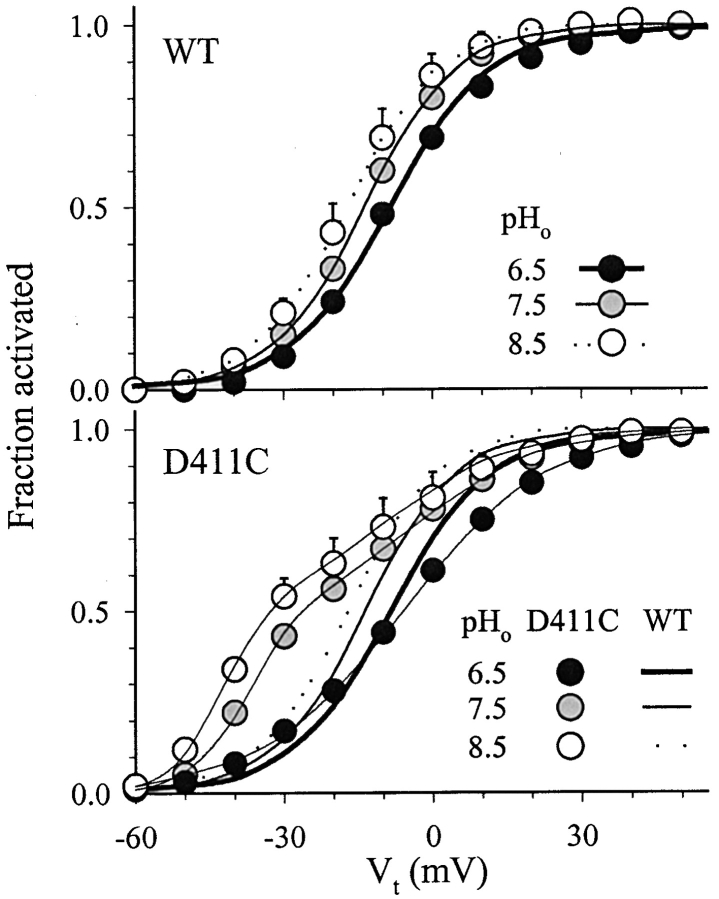
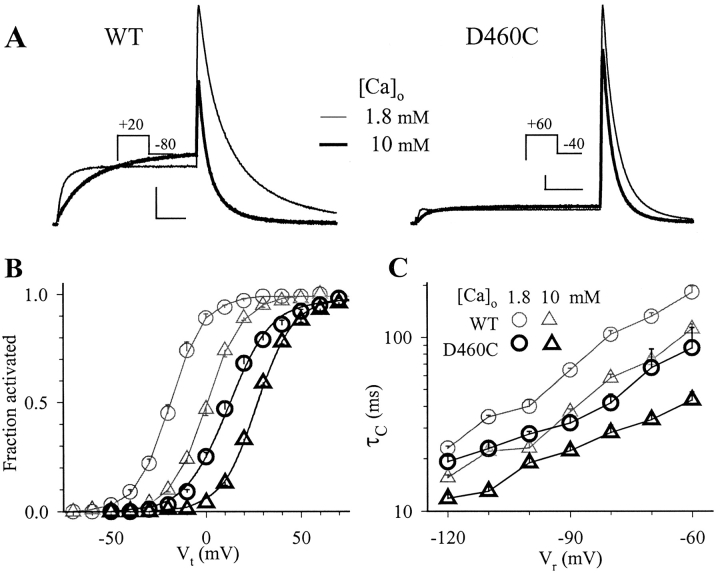
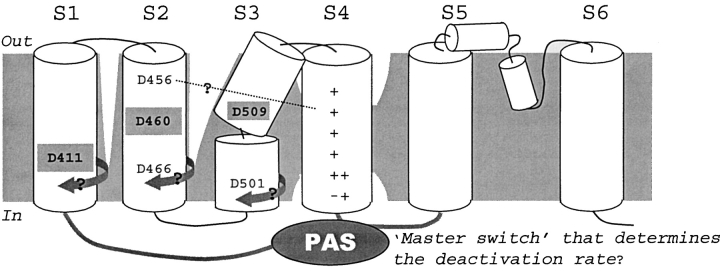
The transmembrane domains of HERG (S1-S3) contain six negative charges: three are conserved in all voltage-gated K channels (D456 and D466 in S2, D501 in S3) and three are unique to the EAG family (D411 in S1, D460 in S2, and D509 in S3). We infer the functional role of these aspartates by studying how substituting them with cysteine, one at a time, affects the channel function. D456C is not functional, suggesting that this negative charge may play a critical role in channel protein folding during biogenesis, as has been shown for its counterpart in the Shaker channel. Data from the other five functional mutants suggest that D411 can stabilize the HERG channel in the closed state, while D460 and D509 have the opposite effect. D466 and D501 both may contribute to voltage-sensing during the activation process. On the other hand, all five aspartates work in a concerted fashion in contributing to the slow deactivation process of the HERG channel. Accessibility tests of the introduced thiol groups to extracellular MTS reagents indicate that water-filled crevices penetrate deep into the HERG protein core, reaching the cytoplasmic halves of S1 and S2. At these deep locations, accessibility of 411C and 466C to the extracellular aqueous phase is voltage dependent, suggesting that conformational changes occur in S1 and S2 or the surrounding crevices during gating. Increasing extracellular [H+] accelerates HERG deactivation. This effect is suppressed by substituting the aspartates with cysteine, suggesting that protonation of these aspartates may contribute to the signaling pathway whereby external [H+] influences conformational changes in the channel's cytoplasmic domains (where deactivation takes place). There is no evidence for a metal ion binding site coordinated by negative charges in the transmembrane domains of HERG, as the one described for the EAG channel.


Figures

F<sc>igure</sc> 1.
Figure 1.
(A) Alignment of amino acid sequences of S1–S4 transmembrane domains for HERG, Drosophila EAG (dEAG), and Shaker (dShB). The S1–S3 alignments are based on the conserved aspartate or glutamate residues (D and E, highlighted by gray shades or boxes). The S4 alignment is that proposed in Gandhi and Isacoff (2002), which is based on the state dependence of side chain accessibility to extracellular MTS reagents. The negatively charged residues in S1–S3 are designated as −1 to −6. The positive charges in dShB S4 are designated as +1 to +7. The charge distribution along S4 in HERG and dEAG differs from that of dShB, as is noted above the amino acid sequences. The arrow points to well-conserved proline residues that cause a kink in the S3 helix (Li-Smerin and Swartz, 2001). (B) Residues and position numbers for the negatively charged residues in S1–S3 of HERG and dEAG, and S2–S3 of dShB. (C) Cartoon of transmembrane topology of a Kv channel subunit, highlighting: (a) the negative and positive charges in the transmembrane domains, (b) difference in S4 charge distribution between dShB and HERG or dEAG, (c) known interactions between charged residues in dShB (−2 with +3 and +4, −4, and −5 with +5; Papazian et al., 2002), (d) a metal ion (Me2+) binding site formed by −3 and −6 in dEAG (Papazian et al., 2002), and (5) putative water-filled crevices around S2, S3, and S4 (in the activated state).
F<sc>igure</sc> 2.
Figure 2.
Voltage clamp protocols and data analysis for the characterization of channel function using wild-type (WT) HERG as an example. (A) Voltage dependence of activation. Top inset: voltage clamp protocol. Bottom inset: representative original current traces elicited by the protocol. The gray shade highlights the peak of tail currents that is used to estimate the degree of channel activation. The main graph depicts summary activation curve calculated from Eq. 1, V0.5 = −13.6 ± 1.3 mV and zg = 2.70 ± 0.07. (B) Time constant of activation (τo) and its voltage dependence. Top inset: “envelope test” protocol. Bottom inset: representative original current traces elicited by the envelope test protocol at a Vt of +20 mV. The solid curve superimposed on the current traces is calculated from Eq. 3, with tdelay = 1.7 ms and τo = 97 ms. The main graph depicts summary data plotted on a semilogarithmic scale, superimposed on a line calculated from Eq. 4. The value of zo is obtained by a linear regression analysis of relationship between ln(K o(V)) and Vt in the Vt range of −40 to +40 mV (0.83). (C) Fully-activated current-voltage (If-a-V) relationship. Top inset: voltage clamp protocol. Bottom inset: original current traces elicited by the protocol. The gray shade highlights the peak tail current amplitudes used to construct the If-a-V curve. The main graph depicts the average If-a-V relationship. (D) Time constant of the fast component of deactivation. The protocol is the same as that in C. Inset: original data (open circles, showing only every twentieth data points) and fitting result (superimposed solid curves) at Vr −80 and −120 mV. The main graph reports τc values plotted on a semilogarithmic scale. (E) Voltage clamp protocol and curve fitting to estimate the time constant of inactivation (τI). The main graph depicts current traces (plotted every twentieth data points) recorded during the second and third pulses (shaded portion of the protocol), superimposed with one-exponential fit to the decay phase during the third pulse. (F) Summary data of τI values from −20 to +40 mV. Data shown in the main graphs are summarized from 3–11 cells each. These WT data are shown again as open triangles in Figs. 3–6 and 8, as a comparison with data from mutant channels. Calibration bars correspond to 1 μA and 0.2 s, except those in E (5 μA and 10 ms).
SCHEME I
SCHEME I
F<sc>igure</sc> 3.
Figure 3.
D411C channel function. (A) Representative D411C current traces elicited by the voltage clamp protocols shown on top. (B) Comparison of activation curve of D411C with that of WT-HERG. D411C and WT data are shown as closed circles and open triangles, respectively (same for C–E except τI values in D, for which D411C data are depicted as open circles). The curve superimposed on the D411C data points is calculated from Eq. 2 with: A1 = 0.47 ± 0.03, V1 = −37.6 ± 0.9 mV, z1 = 4.83 ± 0.42, A2 = 0.53 ± 0.03, V2 = −3.7 ± 2.4 mV, and z2 = 2.06 ± 0.16. (C) Comparison of τ of activation between D411C and WT. (Inset) D411C current traces elicited by the envelope test protocol at Vt +20 mV. (Main graph) D411C data points are superimposed on a line calculated from Eq. 4, with zo = 0.47. (D) Comparison of If-a-V relationship (left ordinate) and τI values (right lower ordinate) between D411C and WT. (E) Comparison of τc of deactivation between D411C and WT. (Inset) Superimposed D411C and WT tail currents recorded at Vr −80 mV, with open symbols showing every twentieth data point and solid curves showing calculations from Eq. 5. The current amplitudes are scaled to match the peaks. (Main graph) Summary of D411C data versus WT data. D411C data in main graphs are averaged from 5 to 10 cells each. The gray shade in C and E indicates the voltages at which the original current traces shown in insets are measured. Calibration bars correspond to 1 μA and 0.2 s (except panel C inset, for which the time calibration bar is 50 ms).
F<sc>igure</sc> 4.
Figure 4.
D460C channel function. The format of this figure is the same as that of Fig. 3. The D460C data in main graphs are averaged from seven to nine cells each. In B, the D460C activation curve has V0.5 = 20.9 ± 0.3 mV, and zg = 2.35 ± 0.08. In C, D460C data points are superimposed on a line calculated from Eq. 4 with zo = 0.83. Calibration bars correspond to 1 μA and 0.2 s.
F<sc>igure</sc> 5.
Figure 5.
D466C channel function. The format is the same as that of Fig. 3. D466C data in main graphs have n = 5–11 each. In B, the D466C activation curve has V0.5 = 28.2 ± 0.9 mV, and zg = 1.48 ± 0.01. In C, the D466C data points are superimposed on a line calculated from Eq. 4 with zo = 0.48. Calibration bars correspond to 1 μA and 0.2 s.
F<sc>igure</sc> 6.
Figure 6.
D501C channel function. The format is the same as that of Fig. 3. Note that in oocytes forced to overexpress D501C, the native Cl current becomes prominent (highlighted by gray shades in A). (B) D501C activation curve has V0.5 = 7.6 ± 2.5 mV and zg = 1.66 ± 0.09. (C) Values of τo for both WT and D501C measured in 98 mM [K]o. The data points are superimposed on lines calculated from Eq. 4, with zo values of 1.0 and 0.16 for WT and D501C, respectively. The D501C data in main graphs are averaged from four to seven cells each. Calibration bars correspond to 1 μA and 0.2 s.
F<sc>igure</sc> 7.
Figure 7.
Comparison of gating behavior between D501C and WT recorded in 98 mM [K]o. (A) Activation curves. For WT, V0.5 = −25.4 ± 2.2 mV, zg = 2.79 ± 0.03. For D501C, V0.5 = −2.8 ± 0.6 mV, zg = 1.45 ± 0.05. (B) Comparison of τc values between D501C and WT. (Inset) WT and D501C tail currents and curve fitting at −80 mV. Data are summarized from three to four cells each. Calibration bars correspond to 1 μA and 0.2 s.
F<sc>igure</sc> 8.
Figure 8.
D509C channel function. The format is the same as that of Fig. 3. In B, the D509C activation curve has V0.5 = 22.7 ± 1.4 mV and zg = 1.88 ± 0.04. In C, the D509C data points are superimposed on a line calculated from Eq. 4, with zo = 1.15. The D509C data in main graphs are averaged from 9 to 10 cells each. Calibration bars correspond to 1 μA and 0.2 s (except panel C, for which the time calibration bar is 0.5 s).
F<sc>igure</sc> 9.
Figure 9.
Testing the accessibility of thiol side chain at position 411 to extracellular MTSET. (A) Left, experimental protocol. Right, superimposed tail current traces (at −80 mV, gray shade in inset) recorded from two experiments. The Vh and pulse numbers are marked. (B) Summary data. The peak amplitudes of tail currents are normalized by the control value just before MTSET application, and plotted against pulse numbers. Data points from different experiments are denoted by different symbols as denoted in the inset (n = 6 for Vh −20 mV, and n = 4 for Vh −80 mV). Calibration bars correspond to 1 μA and 0.1 s.
F<sc>igure</sc> 10.
Figure 10.
Testing the accessibility of thiol side chain at position 460 to extracellular MTSET or MTSES. The format of A is the same as that in Fig. 9 A. The voltage clamp protocol is modified because of the positive shift in D460C activation relative to D411C. (B) MTSET effects on D460C are similar when applied at either Vh −80 or +20 mV (n = 3 each). Data are taken from experiments similar to those shown in A. The MTSET effect is shown as a percentage of reduction, based on peak tail current amplitude of pulses 1 and 6. (C) Modification of 460C by MTSET reduces current amplitude while modification by MTSES has the opposite effect. Shown are time courses of changes in D460C tail current amplitude before, during and after exposure to MTSET (1 mM) or MTSES (10 mM). Data points during MTS exposure are highlighted. Similar findings are obtained in 15 (MTSET) and 6 (MTSES) cells. Calibration bars correspond to 1 μA and 0.1 s.
F<sc>igure</sc> 11.
Figure 11.
Testing the accessibility of thiol side chain at position 466 to extracellular MTSET. The format is similar to that of Fig. 10. Data in B are summarized from three cells each (*, P < 0.01). Calibration bars correspond to 0.5 μA and 0.1 s.
F<sc>igure</sc> 12.
Figure 12.
Testing the accessibility of thiol side chain at position 509 to extracellular MTSET or MTSES. The format of A and B is similar to that of Fig. 9, A and B. MTSET exposure induces a marked acceleration of D509C deactivation with little or no effects on the peak tail current amplitude. Therefore, the half-time of decay of tail current at −60 mV (T1/2) is used as a measure of MTSET effect. Data in B are from five experiments denoted by different symbols. (C) MTSES (10 mM) slows D509C deactivation. Similar data are obtained from a total of three oocytes. Calibration bars correspond to 1 μA and 0.2 s.
F<sc>igure</sc> 13.
Figure 13.
Effects of changing pHo on the deactivation kinetics at −60 mV for WT and mutant channels. Each panel depicts tail current traces elicited by the protocol shown on top, recorded from the same cell at pHo 6.5 (long dashed line), 7.5 (thin solid line), and 8.5 (dotted line). The traces are scaled to match the peaks. Note differences in the time calibration bars (corresponding to 0.1 s). Similar data are obtained from a total of 4–6 oocytes each.
F<sc>igure</sc> 14.
Figure 14.
Effects of changing pHo on the voltage dependence of activation for WT (top) and D411C (bottom). The voltage clamp protocol and data analysis are the same as those described for Figs. 2 A and 3 A, respectively, except D411C data at pHo 6.5 (fit with a single, but not double, Boltzmann function). Data points at pHo 6.5, 7.5, and 8.5 are shown as black, gray, and white circles, respectively, and superimposed on curves calculated from the Boltzmann functions. For comparison, the WT activation curves are shown again in the bottom panel. Data are summarized from 4–6 cells each.
F<sc>igure</sc> 15.
Figure 15.
Elevating [Ca]o has similar effects on WT and D460C. (A) Original current traces of WT and D460C from same cells in specified [Ca]o (1.8 mM thin traces, 10 mM thick traces), elicited by the voltage clamp protocols diagrammed in respective insets. (B) Voltage dependence of WT and D460C activation measured in 1.8 or 10 mM [Ca]o. (C) Time constant of fast component of deactivation for WT and D460C measured in 1.8 and 10 mM [Ca]o. The symbols shown in inset of C also apply to B. Data points in B and C are summarized for four cells each. Calibration bars correspond to 1 μA and 0.2 s.
F<sc>igure</sc> 16.
Figure 16.
Cartoon of a HERG subunit highlighting conclusions from this study: (a) the penetration of water-filled crevices around S1 and S2 deduced from the accessibility data, and (b) an apparent lack of a metal ion binding site formed by D460 and D509 in HERG as that described for EAG. This cartoon also highlights the following proposals (indicated by ?): (a) D466 and D501 may contribute to gating charge by moving relative to the membrane electrical field either due to a rotation of S2 and/or S3, or due to changes in the crevice around them. (b) There may be a rotation of S1, or the surrounding crevice, at the level of D411. (c) D456 may form an ion pair with S4's positive charge. And (d) binding of the NH2-terminal PAS domain to the cytoplasmic S4-S5 linker serves as a “master-switch” that controls the rate of channel deactivation.

Similar articles

Cited by

References

    1. Bezanilla, F. 2000. The voltage sensor in voltage-dependent ion channels. Physiol. Rev. 80:555–592. - PubMed
    1. Cole, K.S., and J.W. Moore. 1960. Potassium ion current in the squid giant axon: dynamic characteristic. Biophys. J. 1:1–14. - PMC - PubMed
    1. Gandhi, C.S., and E.Y. Isacoff. 2002. Molecular models of voltage sensing. J. Gen. Physiol. 120:455–463. - PMC - PubMed
    1. Gandhi, C.S., E. Loots, and E.Y. Isacoff. 2000. Reconstructing voltage sensor-pore interaction from a fluorescence scan of a voltage-gated K+ channel. Neuron. 27:585–595. - PubMed
    1. Herzberg, I.M., M.C. Trudeau, and G.A. Robertson. 1998. Transfer of rapid inactivation and sensitivity to the class III antiarrhythmic drug E-4031 from HERG to M-eag channels. J. Physiol. 511:3–14. - PMC - PubMed

Publication types