. 2003 May 15;23(10):4108-16.
doi: 10.1523/JNEUROSCI.23-10-04108.2003.

In vivo whole-cell recording of odor-evoked synaptic transmission in the rat olfactory bulb

Affiliations

In vivo whole-cell recording of odor-evoked synaptic transmission in the rat olfactory bulb

Jianhua Cang et al. J Neurosci. .

Abstract

One of the first steps in the coding of olfactory information is the transformation of synaptic input to action potential firing in mitral and tufted (M/T) cells of the mammalian olfactory bulb. However, little is known regarding the synaptic mechanisms underlying this process in vivo. In this study, we examined odor-evoked response patterns of M/T and granule cells using whole-cell recording in anesthetized, freely breathing rats. We find that odor-evoked excitatory responses in M/T cells typically consist of bursts of action potentials coupled to the approximately 2 Hz respiration rhythm. Odor-evoked, rhythmic M/T cell excitation is reliable during odor presentation (2-4 sec); in contrast, both excitatory responses of granule cells and M/T cell lateral inhibition adapt quickly after the first respiration cycle in the presence of odorants. We also find that the amplitude and initial slope of odor-evoked synaptic excitation play an important role in regulating the timing of M/T cell spikes. Furthermore, differences in odor concentration alter the shape of odor-evoked excitatory synaptic responses, the latency of M/T cell spikes, and the timing of M/T cell lateral inhibition.


Figures
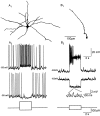
Figure 1.
Figure 1.
Identification of M/T cells. In vivo whole-cell recordings of a mitral cell (A) and a granule cell (B) and their morphology. The resting membrane potentials were approximately −55 and −65 mV for the mitral and granule cells, respectively. M/T cells could be discerned by their extensive lateral dendrites (A1), whereas granule cells had a small soma (B1). The glomerular dendritic tuft of this mitral cell was not recovered. The responses to current injection illustrate the fact that mitral cells (A2) have a lower input resistance than granule cells (B2). Also, individual fast spontaneous EPSPs are typically observed in granule cells (inset) but not M/T cells.
Figure 2.
Figure 2.
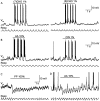
Odors evoke respiration-coupled activity in M/T cells. In each panel, the membrane potential is shown by the top trace and the bottom trace is the simultaneously recorded respiratory activity. Horizontal bars indicate the duration of odor application. For the cell in A, both 1% heptanal [(7)CHO] and octanal [(8)CHO] elicited bursts of respiration-coupled APs during odor stimulation. For the cell in B, 10% AA and 1% CIN elicited bursts of APs coupled to respiration. C, “Pure” inhibitory response of an M/T cell to 100% PP. D, Inhibitory response of another M/T cell to 10% AA. The APs are truncated, and scale bars in C also apply to D.
Figure 3.
Figure 3.
Odors evoke M/T cell excitation that is reliable across respiration cycles. A1, The spiking response of an M/T cell to CIN. The stimulation duration was 4 sec, indicated by the horizontal line. A2, Subthreshold response of the same M/T cell. When hyperpolarized, the M/T cell displayed rhythmic summated EPSPs of∼10 mV during odor stimulation. In bothA1andA2, the onset of inspiration is indicated by vertical lines in the respiration signal (Resp). Traces in A1 and A2 are aligned with respect to the time of odor application. The different latencies to response onset reflect the fact that the first respiration cycle in the presence of odor occurs earlier in A2 compared with A1. The mean AP number (B1) and EPSP amplitude (B2) during each respiration cycle normalized to those of the first cycle after odor onset (n = 8 cells).
Figure 4.
Figure 4.
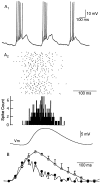
Odor-evoked M/T cell spikes occur preferentially during the rising phase of the EPSP. A1, Firing patterns of an M/T cell during odor application. Three consecutive respiratory cycles in the presence of 100% CIN are shown. A2, The raster plot of spike times, PSTH of odor-evoked APs, and mean odor-evoked EPSP of the M/T cell in A1 were aligned to the time of inspiration onset and shown on the same time scale. Top, A raster plot of 79 cycles of odor-evoked APs. No systematic change of the AP number or timing was observed. Middle, The PSTH of the 79 cycles of APs was constructed with a bin width of 5 msec. Bottom, Averaged EPSP of the subthreshold responses at −70 mV aligned to the onset of inspiration; 65% of the APs in this cell occurred before the peak of the EPSP. B, Group data of the firing probability (filled circles) and subthreshold EPSPs (open circles). For each M/T cell, the firing probability was calculated from the probability density function (PDF) of spike times. The PDF and EPSP were normalized to their peak amplitudes and averaged for five cells. For clarity, only one of every four error bars are plotted.
Figure 5.
Figure 5.
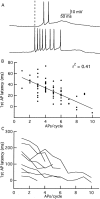
Odor-evoked AP latency and spike number are negatively correlated during respiration cycles. A, Membrane potential of an M/T cell during two respiration cycles in response to 100% CIN. The first AP latency, determined by the delay from the 10% onset of the averaged EPSP (indicated by the vertical dashed line; see Materials and Methods), is smaller for the response with eight APs than that with two APs. B, Plot of first AP latency versus AP number of one M/T cell. First AP latency and the number of APs in each cycle are negatively correlated (r2 = 0.41; p < 0.001). C, Group data showing the results for nine cells. Each line represents one cell and shows the mean of the first AP latency plotted against the AP number in each respiration cycle. For clarity, error bars are omitted.
Figure 6.
Figure 6.
Odor-evoked M/T cell spiking is dependent on odor intensity. A, Responses of an M/T cell to 10% CIN. A1, Single trial responses in the presence of odor. A2, Raster plots of 40 consecutive cycles from multiple trials. B, Responses of the same M/T cell to 100% CIN. Increasing odor intensity caused the M/T cell to respond with more APs during each respiration cycle, and the first APs occurred earlier in each cycle. The group data of average APs per cycle (C), first AP latency (D), and ISI (E) are shown for each cell in response to high and low odor intensity. Each line connects the two points representing the averages of each cell at the two conditions.
Figure 7.
Figure 7.
The amplitude and slope of odor-evoked M/T cell EPSPs are governed by odor intensity. A, Superimposed average EPSPs evoked by 10 and 100% CIN in the same M/T cell. B1, Summary data of odor intensity-dependent changes in EPSP amplitude. Each line represents the responses of one cell under the two conditions. B2, Summary data of the effect of changes in odor intensity on EPSP initial slope.
Figure 8.
Figure 8.
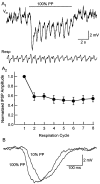
Odor-evoked M/T cell inhibition. A1, Inhibitory response of an M/T cell to 100% PP. Top, Membrane potential. Bottom, Respiration signal. The horizontal line indicates the duration of odor stimulation (4 sec). A2, Normalized IPSP amplitudes were plotted against respiration cycle(n=6).B, The odor-evoked IPSPs of another M/T cell were aligned to the inspiration onset of each respiration cycle and averaged. The average IPSP in response to strong odor stimulation (100% PP) occurs earlier than that evoked by weaker odor stimulation (10% PP).
Figure 9.
Figure 9.
Spontaneous EPSPs and EPSCs in granule cells. A, Current-clamp recording of a granule cell. A1, A short record of membrane potential illustrating that granule cells receive a high frequency of EPSPs. A2, Average of individual EPSPs. B, Voltage-clamp recording (Vm = −80 mV) of the same granule cell (B1) and average of the EPSCs (B2). Histograms of spontaneous EPSC peak amplitudes (filled bars) and background noise (open bars) (B3), decay time constants (B4), and rise times (B5) are shown.
Figure 10.
Figure 10.
Odor-evoked responses of granule cells. A, Responses of a single granule cell to 10% (A1) and 100% (A2) CIN. The same granule cell also responded to 10% AA (A3). Horizontal bars indicate the duration of odor application. APs in A1 and A2 are truncated to better illustrate subthreshold EPSPs. B, Amplitudes of granule cell responses during each respiration cycle normalized to that of the first cycle after odor onset (n = 10). Response amplitudes in the second, third, and fourth cycles are significantly smaller than that during the first cycle. C, Four selected cycles of odor-evoked (10%AA) responses of another granule cell. D, Spike-triggered average of odor-evoked responses of the same cell in C. On average, this granule cell required a depolarization of 23 mV to reach the AP threshold.

Similar articles

Cited by

References

    1. Belluscio L, Katz LC ( 2001) Symmetry, stereotypy, and topography of odorant representations in mouse olfactory bulbs. J Neurosci 21: 2113–2122. - PMC - PubMed
    1. Blanton MG, Lo Turco JJ, Kriegstein AR ( 1989) Whole cell recording from neurons in slices of reptilian and mammalian cerebral cortex. J Neurosci Methods 30: 203–210. - PubMed
    1. Buck L, Axel R ( 1991) A novel multigene family may encode odorant receptors: a molecular basis for odor recognition. Cell 65: 175–187. - PubMed
    1. Chaput M, Holley A ( 1980) Single unit responses of olfactory bulb neurones to odour presentation in awake rabbits. J Physiol (Paris) 76: 551–558. - PubMed
    1. Chaput MA ( 2000) EOG responses in anesthetized freely breathing rats. Chem Senses 25: 695–701. - PubMed

Publication types

LinkOut - more resources