

Interaction of soft condensed materials with living cells: phenotype/transcriptome correlations for the hydrophobic effect
- PMID: 12746496
- PMCID: PMC164446
- DOI: 10.1073/pnas.1031426100
Interaction of soft condensed materials with living cells: phenotype/transcriptome correlations for the hydrophobic effect
Abstract
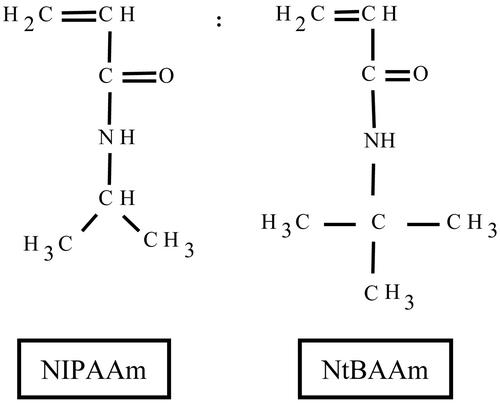
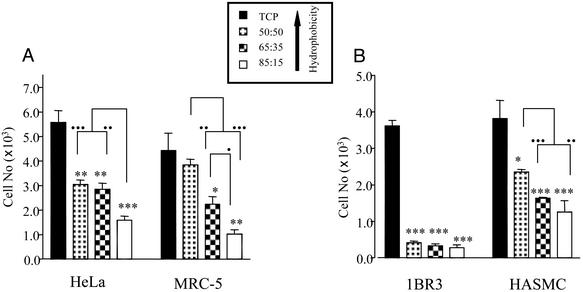
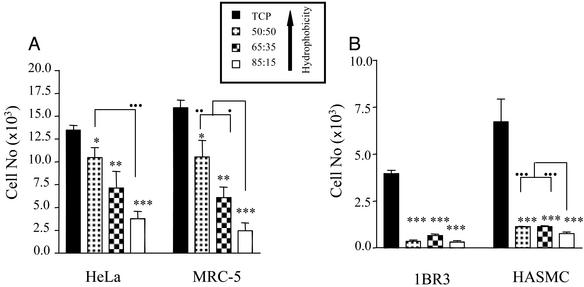
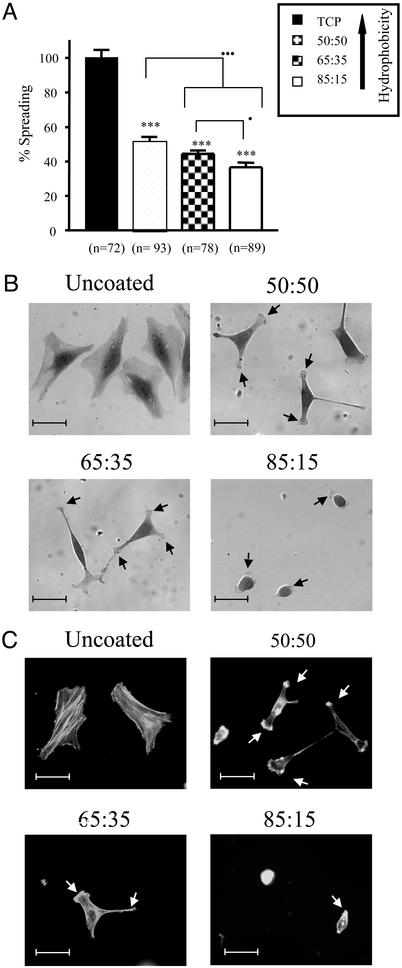
The assessment of biomaterial compatibility relies heavily on the analysis of macroscopic cellular responses to material interaction. However, new technologies have become available that permit a more profound understanding of the molecular basis of cell-biomaterial interaction. Here, both conventional phenotypic and contemporary transcriptomic (DNA microarray-based) analysis techniques were combined to examine the interaction of cells with a homologous series of copolymer films that subtly vary in terms of surface hydrophobicity. More specifically, we used differing combinations of N-isopropylacrylamide, which is presently used as an adaptive cell culture substrate, and the more hydrophobic, yet structurally similar, monomer N-tert-butylacrylamide. We show here that even discrete modifications with respect to the physiochemistry of soft amorphous materials can lead to significant impacts on the phenotype of interacting cells. Furthermore, we have elucidated putative links between phenotypic responses to cell-biomaterial interaction and global gene expression profile alterations. This case study indicates that high-throughput analysis of gene expression not only can greatly refine our knowledge of cell-biomaterial interaction, but also can yield novel biomarkers for potential use in biocompatibility assessment.
Figures
Similar articles
-
The combined effect of surface chemistry and flow conditions on Staphylococcus epidermidis adhesion and ica operon expression.Eur Cell Mater. 2012 Nov 17;24:386-402. doi: 10.22203/ecm.v024a28. Eur Cell Mater. 2012. PMID: 23160991
-
A cooperative polymer-DNA microarray approach to biomaterial investigation.Lab Chip. 2009 Feb 7;9(3):397-403. doi: 10.1039/b808363k. Epub 2008 Nov 14. Lab Chip. 2009. PMID: 19156288
-
Use of thermosensitive polymer material on the basis of N-isopropylacrylamide and N-tert-butylacrylamide copolymer in cell technologies.Bull Exp Biol Med. 2006 Oct;142(4):538-41. doi: 10.1007/s10517-006-0411-x. Bull Exp Biol Med. 2006. PMID: 17415456 English, Russian.
-
Examination of cell-host-biomaterial interactions via high-throughput technologies: A re-appraisal.Biomaterials. 2010 Sep;31(26):6667-74. doi: 10.1016/j.biomaterials.2010.05.029. Epub 2010 Jun 16. Biomaterials. 2010. PMID: 20557931 Review.
-
The study of mammalian oocyte competence by transcriptome analysis: progress and challenges.Mol Hum Reprod. 2014 Feb;20(2):103-16. doi: 10.1093/molehr/gat082. Epub 2013 Nov 13. Mol Hum Reprod. 2014. PMID: 24233546 Review.
Cited by
-
Rationalising the design of polymeric thermoresponsive biomaterials.J Mater Sci Mater Med. 2004 Apr;15(4):513-7. doi: 10.1023/b:jmsm.0000021130.11711.16. J Mater Sci Mater Med. 2004. PMID: 15332627
-
Nucleation of protein fibrillation by nanoparticles.Proc Natl Acad Sci U S A. 2007 May 22;104(21):8691-6. doi: 10.1073/pnas.0701250104. Epub 2007 May 7. Proc Natl Acad Sci U S A. 2007. PMID: 17485668 Free PMC article.
-
Self‑assembled monolayers of alkanethiolates on surface chemistry groups in osteosarcoma cells.Mol Med Rep. 2015 Feb;11(2):975-81. doi: 10.3892/mmr.2014.2876. Epub 2014 Nov 6. Mol Med Rep. 2015. PMID: 25373556 Free PMC article.
-
Overview of the main methods used to combine proteins with nanosystems: absorption, bioconjugation, and encapsulation.Int J Nanomedicine. 2010 Feb 2;5:37-49. Int J Nanomedicine. 2010. PMID: 20161986 Free PMC article. Review.
-
Fluorinated molecular beacons as functional DNA nanomolecules for cellular imaging.Chem Sci. 2017 Oct 1;8(10):7082-7086. doi: 10.1039/c7sc02819a. Epub 2017 Aug 21. Chem Sci. 2017. PMID: 29147537 Free PMC article.
References
-
- Rihova, B. (1996) Adv. Drug Delivery Rev. 21, 157–176.
-
- Dawson, K. A. (2002) Curr. Opin. Colloid Interface Sci. 7, 218–227.
-
- Tang, L. & Eaton, J. W. (1995) Am. J. Clin. Pathol. 103, 466–471. - PubMed
-
- Ito, Y. (1999) Biomaterials 20, 2333–2342. - PubMed
-
- Rochev, Y., Golubeva, T., Gorelov, A., Allen, L. T., Gallagher, W. M., Selezneva, I., Gavrilyuk, B. & Dawson, K. (2001) Prog. Colloid Polym. Sci. 118, 153–156.
Publication types
MeSH terms
Substances
LinkOut - more resources
Full Text Sources
Other Literature Sources
