. 2003 May;23(10):3377-91.
doi: 10.1128/MCB.23.10.3377-3391.2003.

Distinct transcriptional pathways regulate basal and activated major histocompatibility complex class I expression

Affiliations

Distinct transcriptional pathways regulate basal and activated major histocompatibility complex class I expression

T Kevin Howcroft et al. Mol Cell Biol. 2003 May.

Abstract

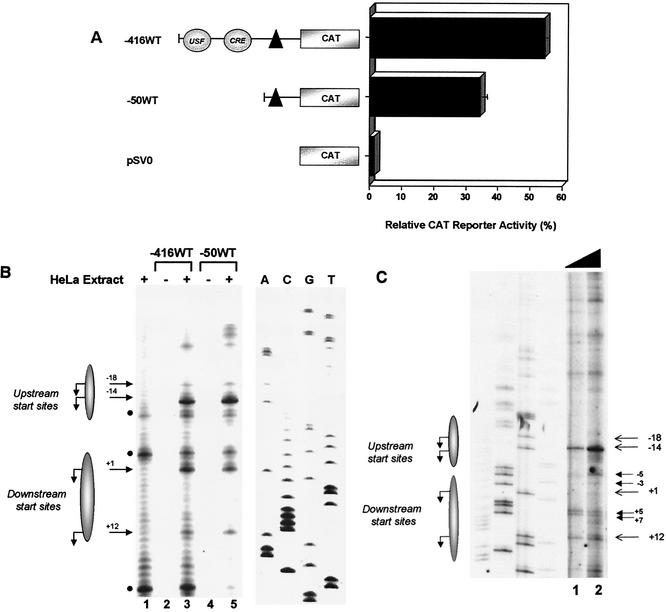
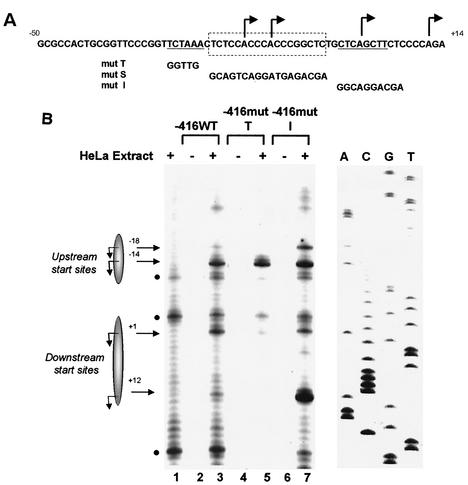
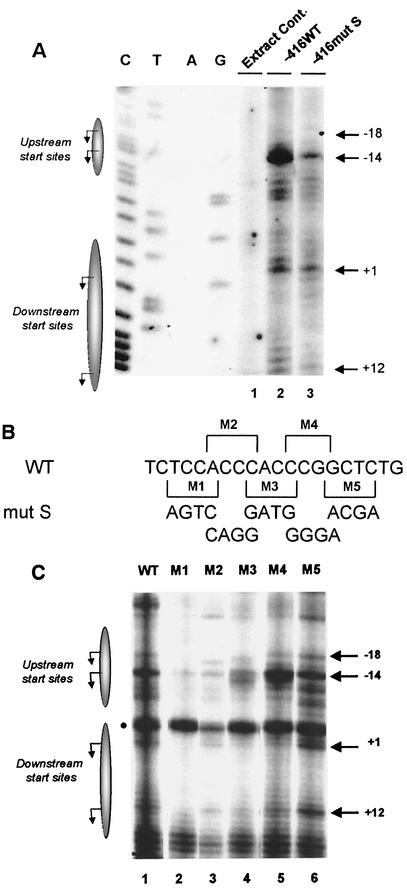
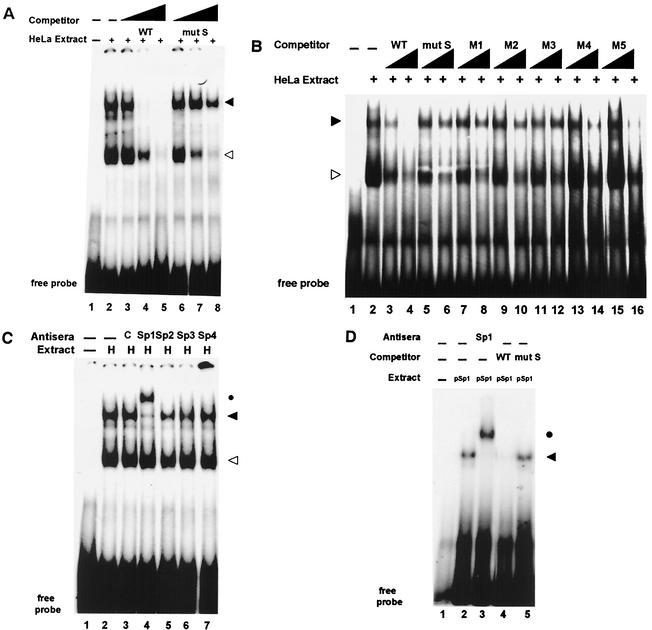
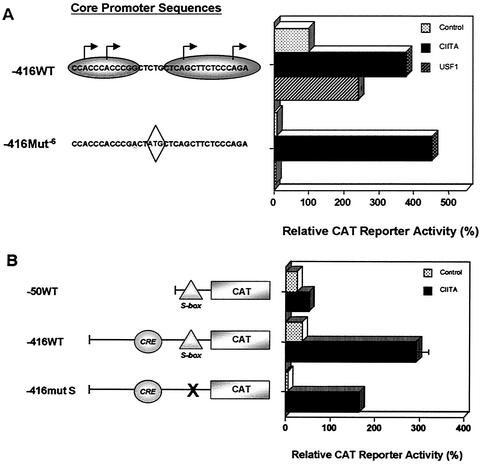
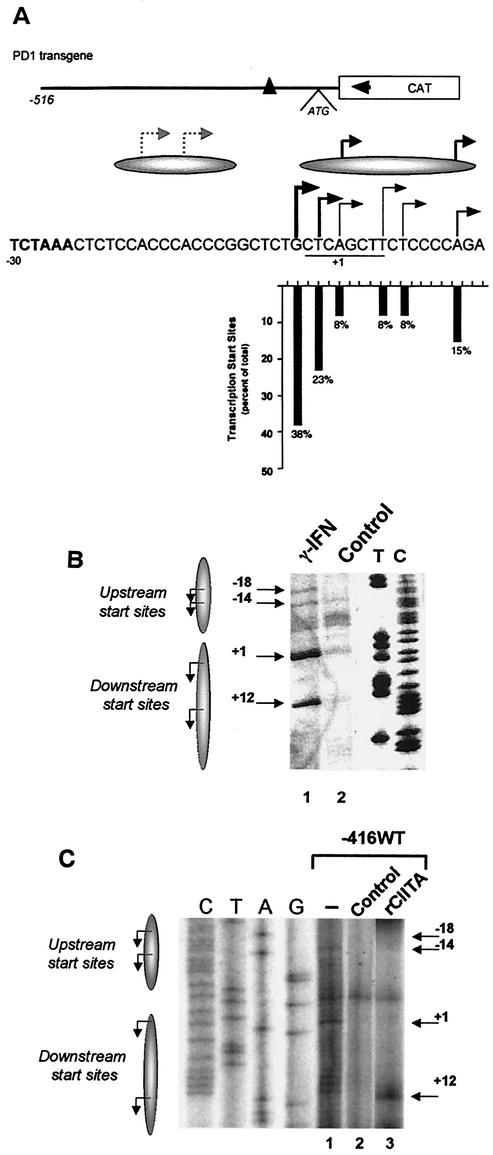
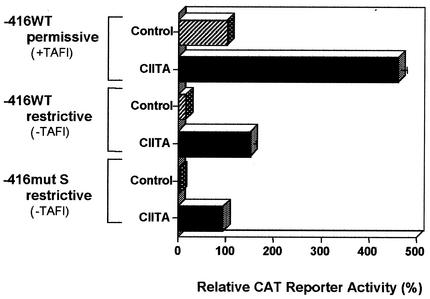
Transcription of major histocompatibility complex (MHC) class I genes is regulated by both tissue-specific (basal) and hormone/cytokine (activated) mechanisms. Although promoter-proximal regulatory elements have been characterized extensively, the role of the core promoter in mediating regulation has been largely undefined. We report here that the class I core promoter consists of distinct elements that are differentially utilized in basal and activated transcription pathways. These pathways recruit distinct transcription factor complexes to the core promoter elements and target distinct transcription initiation sites. Class I transcription initiates at four major sites within the core promoter and is clustered in two distinct regions: "upstream" (-14 and -18) and "downstream" (+12 and +1). Basal transcription initiates predominantly from the upstream start site region and is completely dependent upon the general transcription factor TAF1 (TAF(II)250). Activated transcription initiates predominantly from the downstream region and is TAF1 (TAF(II)250) independent. USF1 augments transcription initiating through the upstream start sites and is dependent on TAF1 (TAF(II)250), a finding consistent with its role in regulating basal class I transcription. In contrast, transcription activated by the interferon mediator CIITA is independent of TAF1 (TAF(II)250) and focuses initiation on the downstream start sites. Thus, basal and activated transcriptions of an MHC class I gene target distinct core promoter domains, nucleate distinct transcription initiation complexes and initiate at distinct sites within the promoter. We propose that transcription initiation at the core promoter is a dynamic process in which the mechanisms of core promoter function differ depending on the cellular environment.


Figures

FIG. 1.
FIG. 1.
Identification of a minimal MHC class I core promoter region. (A) HeLa cells were transiently transfected with MHC class I promoter constructs −416WT, −50WT, and promoterless pSV0. The −50WT extends upstream from positions +14 to −50, whereas −416WT extends upstream from positions +14 to −416 and contains USF and CRE regulatory elements. Class I promoter and pSV0 control constructs, diagrammed on the left, are all ligated to the CAT reporter. Data are expressed as relative percentages of acetylation corrected to an internal transfection control, pSV2LUC. The black triangle represents the core promoter region. Error bars indicate the standard error. (B) In vitro transcriptional start sites utilized by −416WT and −50WT constructs were determined by primer extension of in vitro-transcribed RNA. HeLa extract alone control is shown in the lane 1. Background bands present in the HeLa extract alone control are indicated by solid black circles. DNA-only controls for −416WT and −50WT are shown in lanes 2 and 4, respectively. The arrows along the left indicate specific transcriptional start sites in lanes 3 and 5, in the presence of HeLa nuclear extract. Shaded ellipses representing upstream and downstream transcription start site regions (where the major start sites, indicated by arrows, were observed to originate) are provided on the left for orientation. The scan encompasses the length of the −50WT class I sequences. A sequence ladder for the class I promoter used in these studies (shown on the right) was generated by using the same primer used in primer extension analysis of in vitro-synthesized RNA and was used to determine the precise start sites. Minor start sites were also inconsistently observed at other sites upon longer exposure. (C) RNA was prepared from a fibroblast cell line (93B2) containing a stably integrated PD1 MHC class I gene. Increasing amounts of total RNA, 3 and 10 μg (lanes 1 and 2) were analyzed by primer extension to determine start site utilization in vivo. Shadowed ellipses representing the upstream and downstream transcription regions where the major start sites originate in in vitro transcription (indicated by arrows) are provided on the left for orientation. The −3 and −5 start sites, observed in vivo with 93B2 RNA, would have been obscured by a nonspecific band generated by HeLa nuclear extract in in vitro transcription reactions (see Fig. 1B). A sequence ladder of the class I promoter is also included.
FIG. 2.
FIG. 2.
Role of core promoter sequences in determining start site usage. (A) The minimal MHC class I core promoter sequence from bp −50 to +14 is shown. The TATAA- and Inr-like sequences are underlined, and the S-box containing the CA/GT-rich element is within the dotted box. Major transcription start sites (determined in Fig. 1B) are indicated by the arrows. Core promoter mutations introduced into the −416 construct, mut T, mut I, and mut S are shown at the bottom and are aligned as they appear in the mutant core promoter constructs. (B) Primer extension analysis to examine in vitro transcriptional start site utilization by −416mut T and mut I. HeLa extract alone control is shown in the lane 1. Background bands are indicated by black solid circles. DNA-only controls for −416WT, −416mut T, and −416mut I are shown in lanes 2, 4, and 6, respectively. Specific, transcriptional start sites (in lanes 3, 5, and 7) in the presence of HeLa extract are indicated by the arrows. Shaded ellipses representing the upstream and downstream transcription regions are provided for orientation. A sequence ladder of the class I promoter is also included.
FIG. 3.
FIG. 3.
The S-box is essential for basal MHC class I transcription. (A) Mutation of the S-box in the extended −416 class I promoter construct (−416mut S, Fig. 2A) dramatically reduced transcription initiations in vitro. In vitro transcription reactions of −416WT and −416mut S constructs were analyzed by primer extension analysis. HeLa extract alone control is shown in the lane 1. Specific, transcriptional start sites generated by −416WT and −416mut S, in lanes 2 and 3, respectively, are indicated by the arrows. Additional, less-utilized start sites are observed throughout the WT core promoter region upon the longer exposure time required to observe initiations in −416mut S. (B) Scanning mutations of 4 bp across the S-box region were introduced into the −416 promoter construct to map the minimal S-box region required for basal transcription. Brackets indicate the 4-bp regions, M1 to M5, that were individually introduced into the −416 promoter construct. The mutated sequences appear at the bottom. (C) The effect of the S-box scanning mutants (M1 to M5) on in vitro transcription of the extended −416 promoter in HeLa extract was examined by primer extension analysis. Transcription start sites generated by the WT promoter are shown in lane 1, and those generated by mutants M1 to M5 are shown in lanes 2 to 6, respectively. The arrowheads indicate major transcriptional start sites, and the solid circle indicates a background band observed in HeLa extract control (not shown). Shadowed ellipses representing the upstream and downstream transcription regions where the major start sites were observed to originate (indicated by arrows) are provided for orientation.
FIG. 4.
FIG. 4.
The transcription factor Sp1 binds CA/GT-rich S-box element. (A) Gel shift analysis by using the class I core promoter region (−50 to +14), shown in Fig. 2A, as a probe to identify specific core promoter binding complexes. Lane 1 contains probe alone in the absence of HeLa extract. Lane 2 shows two complexes formed in the presence of HeLa extract, indicated by the arrowheads. Lanes 3 to 5 and lanes 6 to 8 represent increasing (102-, 103-, and 104-fold) amounts of unlabeled WT or mut S oligonucleotide competitors, respectively. The solid arrowhead indicates the S-box specific complex; the open arrowhead indicates a nonspecific single-strand binding complex. (B) Mapping the specific S-box binding complex by using the M1 to M5 panel of mutant oligonucleotides detailed in Fig. 3B. Lane 1 contains the core promoter probe in the absence of HeLa extract. Lane 2 shows the two complexes formed in the presence of HeLa extract, indicated by the arrowheads. Lanes 3 and 4 and lanes 5 and 6 represent increasing unlabeled WT or mut S oligonucleotide competitors, respectively. Increasing unlabeled, mutant oligonucleotide competitors, M1 to M5, are shown in lanes 7 to 16, respectively. The S-box-specific complex is indicated by the solid arrowhead. (C) Antibody supershift analysis of the specific S-box binding complex. Lane 1 contains core promoter (−50 to +14) probe in the absence of HeLa extract. Lane 2 contains complexes formed in the presence of HeLa extract, indicated by the arrowheads; the solid arrowhead is the S-box-specific complex. Lane 3 contains control antisera; lanes 4 to 7 contain antisera specific for Sp1, Sp2, Sp3, and Sp4, respectively. The supershifted complex, in the presence of anti-Sp1 antisera, is indicated by the solid circle. (D) Purified Sp1 protein (pSp1) binds to the S-box region of the core promoter. Lane 1 contains probe alone. Lane 2 contains the complex formed in the presence of pSp1, indicated by the solid arrowhead. Lane 3 contains specific anti-Sp1 antiserum against Sp1; the supershifted complex is indicated by the solid circle. Lanes 4 and 5 contain WT and mut S unlabeled competitor oligonucleotides, respectively.
FIG. 5.
FIG. 5.
Basal MHC class I transcription initiates primarily in the upstream region of the core promoter. (A) HeLa cells were transiently transfected with MHC class I promoter constructs −416WT, −416Mut−6, and −416Con−6. Each construct, diagrammed on the left, was ligated to the CAT reporter. Specific mutations in the −416Mut−6 and −416Con−6 core promoter regions are underlined; the out-of-frame ATG generated in −416Mut−6 is enclosed in the diamond. There is no out-of-frame ATG in −416Con−6. The upstream and downstream start site regions observed in in vitro transcription (indicated by the shadowed ellipses) are provided for orientation. Data are expressed as relative percentages of acetylation corrected to the transfection control, pSV2LUC. Error bars indicate the standard error. (B) −416WT and −416Mut−6 promoter regions were ligated upstream of CAT or luciferase reporters. The specific mutations in Mut−6 are underlined. The ATG introduced by the Mut−6 mutations is out of frame with respect to the CAT reporter but in frame with the luciferase reporter. Data are expressed as relative percentages of reporter activities (CAT or luciferase) corrected to the transfection control, pSV2LUC or CMV-β-Gal, respectively. Error bars indicate the standard error. (C) −416WT and −416Mut−6 core promoter sequences, ligated to the CAT reporter, were transcribed in vitro to determine start site usage. Lane 1 is the WT promoter; the major start sites are indicated by arrows. Lane 2 represents the start sites generated by −416Mut−6 in in vitro transcription. The upstream and downstream start site regions indicated by the shadowed ellipses are provided for orientation (the major start sites are indicated by arrows). The solid circle marks a nonspecific band.
FIG. 6.
FIG. 6.
The IFN-γ-induced coactivator CIITA, but not USF1, redirects class I transcription through the downstream start site region and does not require an intact S-box. (A) −416WT and −416Mut−6 promoter constructs ligated to the CAT reporter (5 μg) diagrammed on the left were transiently cotransfected into HeLa epithelial cells with either CIITA (2 μg) or USF1 (2 μg) expression constructs. The upstream and downstream start site regions (indicated by the shadowed ellipses) are provided for orientation; the major start sites observed in in vitro transcription are indicated by arrows, and the class I core promoter sequences they span are indicated. Specific mutations in −416Mut−6 are underlined; the out-of-frame ATG is enclosed in the diamond. Data are expressed as relative percentages of acetylation corrected to the transfection control, pSV2LUC. Error bars indicate the standard errors. (B) CIITA-activated class I promoter activity does not require an intact S-box. −50 WT, −416WT, and −416mut S-box constructs (5 μg), diagrammed on the left, were transiently transfected into HeLa epithelial cells with a CIITA expression construct or control vector (2 μg). The upstream CRE element, required for CIITA activation, is indicated. The S-box is represented by the shaded triangle. Data are expressed as relative percentages of acetylation corrected to the transfection control, pSV2LUC. The error bars indicate the standard errors.
FIG. 7.
FIG. 7.
Mapping basal and activated MHC class I initiation sites in vivo. (A) Results of 5′RACE analysis of −516CAT transgenic spleen RNA to map class I start sites utilized by splenocytes in vivo. The transgene, shown at the top of the figure, extends from −516 to +45 (−516CAT) and is ligated to the CAT reporter gene. The translation initiation codon of the PD1 class I gene is shown relative to the CAT reporter gene; the location of the CAT gene-specific primer used in 5′RACE is indicated by the left arrowhead. 5′RACE products derived from −516CAT transgenic spleen RNA were generated and cloned. More than 300 clones were screened by hybridization; 16 contained class I sequences. All 16 were sequenced to determine the precise transcription initiation sites. Initiation sites, and their relative usage are indicated by the position and size of the right-hand arrows. The relative frequency with which individual sites are used is also indicated at the bottom of the figure and is aligned to the sequence above. Shaded ellipses representing the upstream and downstream transcription regions where the major start sites originate (indicated by arrows) is provided for orientation. The gray, broken arrows represent the upstream start sites that contribute to basal expression, in vitro and in vivo, as determined by primer extension. (B) Nuclear extracts from control and IFN-γ-treated HeLa cells were used in in vitro transcription reactions with a class I reporter construct −516CAT (−516 to +45). Primer extension of in vitro-transcribed RNA was used to identify specific start sites. In vitro generated transcripts generated by IFN-γ-treated HeLa nuclear extract are shown in lane 1; control HeLa extract is shown in lane 2. (C) Purified rCIITA or control lysate from baculovirus-infected cells were added to in vitro transcription reactions by using the class I promoter construct −416WT; specific start sites were detected by using primer extension analysis. Class I-specific transcript in the presence of HeLa extract without added baculovirus lysate is shown in the lane 1. Additions of control lysate and purified rCIITA are shown in lanes 2 and 3, respectively. The principal transcription start sites, detected in Fig. 1B, are indicated by the arrows. Shaded ellipses representing the upstream and downstream transcription regions where the major start sites originate (indicated by arrows) are provided on the left for orientation. A sequence ladder of the class I promoter is also included.
FIG. 8.
FIG. 8.
The IFN-γ-induced coactivator CIITA activates a TAF1 (TAFII250)-independent, Sp1-independent transcription pathway that targets downstream initiation sites. −416WT (5 μg) and −416mut S (5 μg) were transfected at 32°C into the tsBN462 cell line (containing a temperature-sensitive mutant TAF1 [TAFII250] molecule) in the presence or absence of a CIITA expression construct. After 24 h, cells were shifted to 39°C or maintained at 32°C and then incubated for an additional 24 h. The promoters of theCMV-CIITA expression vector and the simian virus 40 pSV2LUC internal are not affected by the temperature shift. The results are presented as promoter activity as assayed by CAT enzyme relative to the −416WT control levels at 32°C. The error bars represent the standard error.

Similar articles

Cited by

References

    1. Aso, T., J. W. Conaway, and R. C. Conaway. 1994. Role of core promoter structure in assembly of the RNA polymerase II ormattedpreinitiation complex: a common pathway for formation of preinitiation intermediates at many TATA and TATA-less promoters. J. Biol. Chem. 269:26575-26583. - PubMed
    1. Baldwin, A. S., Jr., and P. A. Sharp. 1987. Binding of a nuclear factor to a regulatory sequence in the promoter of the mouse H-2Kb class I major histocompatibility gene. Mol. Cell. Biol. 7:305-313. - PMC - PubMed
    1. Berk, A. J. 1999. Activation of RNA polymerase II transcription. Curr. Opin. Cell Biol. 11:330-335. - PubMed
    1. Brodsky, F. M. 1999. Stealth, sabotage, and exploitation. Immunol. Rev. 168:5-11. - PubMed
    1. Burke, T. W., and J. T. Kadonaga. 1997. The downstream core promoter element, DPE, is conserved from Drosophila to humans and is recognized by TAFII60 of Drosophila. Genes Dev. 11:3020-3031. - PMC - PubMed

Publication types

MeSH terms

Substances